# Epidemiological data
#
# Plot from data file that encodes date as an ISO 8601 "week date".
# Example: week date 2004-W01-1 is calendar date 29 December 2003
# The data is from the European Centre for Disease Prevention and Control
# https://www.ecdc.europa.eu/
# The ECDC data file uses fields containing week date as "YYYY-WW".
# First we define a function that extracts the integer year and week
# from this string and converts it to standard time representation.
calendar(date) = weekdate_iso( int(date[1:4]), int(date[6:7]) )
set datafile separator comma
set style data lines
set key Left left reverse box samplen 2 width 2
set grid x lt 1 lw .75 lc "gray"
set tics nomirror
set border 3
set xtics time format "%b\n%Y"
set ytics format " %4.0f"
data1 = '< grep "Denmark.*cases" ECDC-weekly-national-COVID.csv'
data2 = '< grep "Sweden.*cases" ECDC-weekly-national-COVID.csv'
data3 = '< grep "Norway.*cases" ECDC-weekly-national-COVID.csv'
data4 = '< grep "Finland.*cases" ECDC-weekly-national-COVID.csv'
data5 = '< grep "Iceland.*cases" ECDC-weekly-national-COVID.csv'
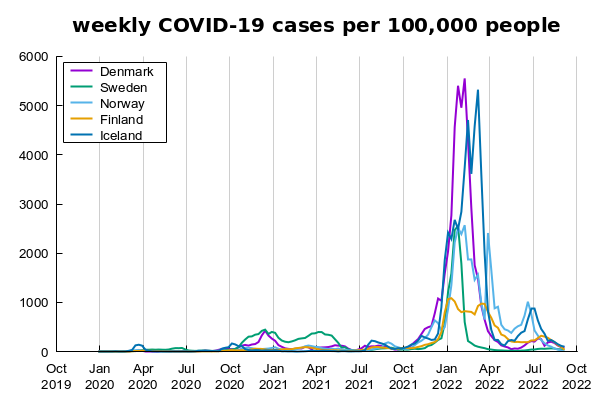
set title "weekly COVID-19 cases per 100,000 people" font ":Bold,15"
plot data1 using (calendar(strcol(7))) : (1.e5*$6/$4) lw 2 title "Denmark", \
data2 using (calendar(strcol(7))) : (1.e5*$6/$4) lw 2 title "Sweden", \
data3 using (calendar(strcol(7))) : (1.e5*$6/$4) lw 2 title "Norway", \
data4 using (calendar(strcol(7))) : (1.e5*$6/$4) lw 2 title "Finland", \
data5 using (calendar(strcol(7))) : (1.e5*$6/$4) lw 2 lt 6 title "Iceland"
Click here for minimal script to generate this plot
