#
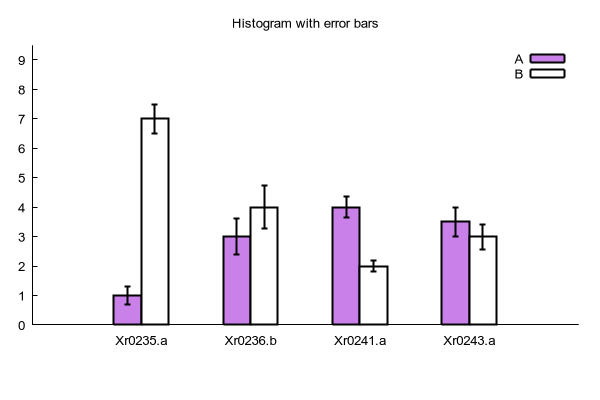
# Histogram with error bars
#
set style data histogram
set key auto column
set yrange [0:*] noextend
set tics nomirror
set border 3
set offset 0,0,2,0
set bmargin 5

set title "Histogram with error bars"
set style fill solid border -1
set style histogram errorbars lw 2
set datafile columnhead separator tab

plot 'histerror.dat' using 2:3 fs solid 0.5 lw 2 ti 'A', \
     '' using 4:5:xticlabel(1) fs solid 0.0 lw 2 ti 'B'


Click here for minimal script to generate this plot
