Back to demo index

gnuplot demo script: lambert.dem

autogenerated by webify.pl on Sun Sep 17 19:56:12 2023
gnuplot version gnuplot 6.0 patchlevel rc2
#
#
#
# Check support for LambertW
if (!strstrt(GPVAL_COMPILE_OPTIONS, "+COMPLEX_FUNC")) {
    print "This copy of gnuplot does not support complex LambertW"
    exit  # return to caller
}
#
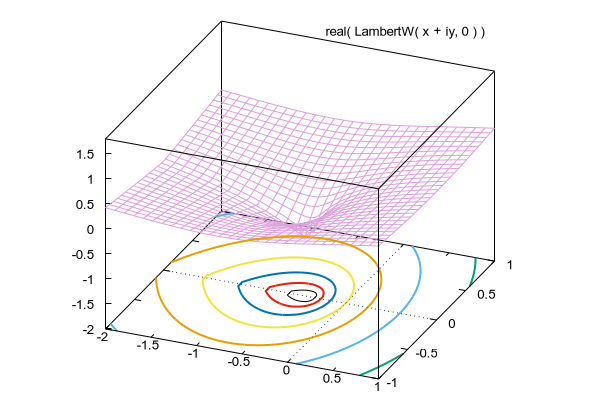
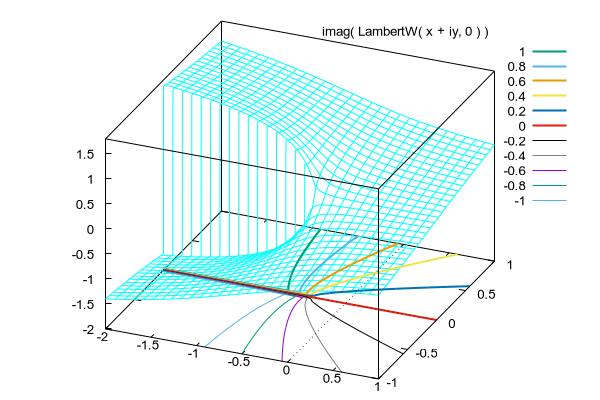
# Complex Lambert W function
#
I = {0,1}
e = exp(1.0)

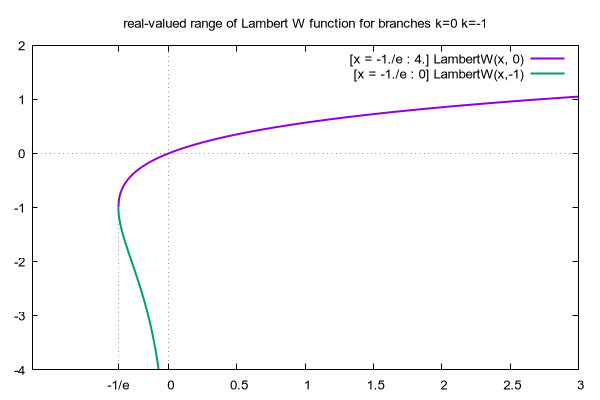
set title "real-valued range of Lambert W function for branches k=0 k=-1"

set xrange [-1:3]
set yrange [-4:2]
set samples 1000
set xzeroaxis
set yzeroaxis
set xtics 0, 0.5
set xtics add ("-1/e" -exp(-1))
set arrow 1 from -1/e, graph 0 to -1/e, LambertW(-exp(-1),0) nohead lt 0

plot sample [x = -1./e : 4.] LambertW(x, 0) lw 2, [x = -1./e : 0] LambertW(x,-1) lw 2


Click here for minimal script to generate this plot


set border -1 front lt black linewidth 1.000 dashtype solid
unset key
unset arrow 1
set xtics 0.5
unset colorbox
set view 42, 23, 0.928406, 1.65
set isosamples 30, 30
set style func lines
set contour base
set cntrparam levels 11
set cntrparam levels incremental -1,0.2
set cntrparam firstlinetype 101
set for [l=2:7] linetype l+99 lc l lw 2
set xyplane at -2
set title  offset character 15
set xrange [ -2.000 : 1.000 ]
set yrange [ -1.000 : 1.000 ]
set zrange [ -2.000 : 1.800 ]

set title "real( LambertW( x + iy, 0 ) )" 
splot real(LambertW( x + I*y, 0 )) lc "plum"


Click here for minimal script to generate this plot


set title "imag( LambertW( x + iy, 0 ) )" 
set key 
splot imag(LambertW( x + I*y, 0 )) lc "cyan" title ""


Click here for minimal script to generate this plot


set view 75, 281, 1.11607, 1.33952
set isosamples 30, 30
set style data lines
set xyplane at 0
set title  font ",15"
set xrange [ -10.00 : 10.00 ]
set yrange [ -8.00 : 12.00 ]
set zrange [ 0.00 : * ] noextend
set ytics offset 0,-1 scale 3.0
set xtics offset 0,-0.5
set pm3d depthorder 
set pm3d border lt black linewidth 0.25
unset colorbox

set title "LambertW( x+{/:Italic i}y, k )"
 
splot for [k=0:4] abs(LambertW(x+y*{0,1}, k)) with pm3d lc k title sprintf("  k = %d",k) at end


Click here for minimal script to generate this plot