#
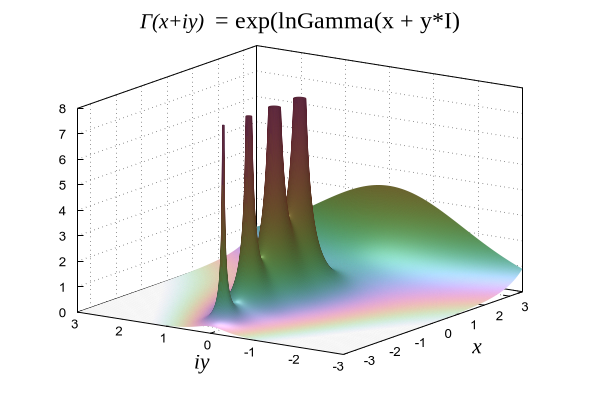
# We don't have a built-in complex Gamma function
# but it can be approximated using exp(lnGamma(z))
#
# Note:
#  - handling of large approximate values near poles could be better
#  - would it be possible to clip +Inf against zmax?
#  - functions are not consistent in returning +Inf or VERYLARGE or NaN
#

# Check support for lnGamma
if (!strstrt(GPVAL_COMPILE_OPTIONS, "+COMPLEX_FUNC")) {
    print "This copy of gnuplot does not support complex lnGamma"
    exit  # return to caller
}

save_encoding = GPVAL_ENCODING
set encoding utf8

unset cornerpoles
set grid x y z vertical lw 1
set border 31 + 768 + 96
set view 66, 304, 1.00286, 1.2
set samples 401
set isosamples 400

set xyplane at 0
set xrange [-3.5 : 3.5]
set yrange [-3.0 : 3.0]
set zrange [ 0.0 : 8.0]
set xlabel "{/Times:Italic=16 x}" offset -3,-1
set ylabel "{/Times:Italic=16 iy}" offset 5,-1
set xtics 1 offset 0,-0.5
set ytics 1 offset 0,-0.5

set pm3d lighting primary 0.5 specular 0.2 spec2 0.4
set palette cubehelix start 0 cycles 2.0 gamma 2.0
set palette negative
set cbrange [0.01:20.]
set log cb
unset colorbox

Gamma(z) = exp(lnGamma(z))
set title "{/Times:Italic=16 Γ(x+iy) }{/Times:Normal=18  = exp(lnGamma(x + y*I)}"
set title offset 0,0.5
unset key

splot abs(Gamma(x + y*I)) with pm3d title "{/Times:Italic=16 Γ(x+iy)}"


Click here for minimal script to generate this plot
