#
# Exercise polar gridded surfaces
# configure --enable-polar-grid
#
# Current bugs:
# - R_AXIS.min nonzero produces an odd plot
# although to be fair it matches existing polar plots
# - polar border should not be clipped by border if the border
# is not drawn (but this would break polar_quadrants.dem
#
if (!strstrt(GPVAL_COMPILE_OPTIONS, "+POLARGRID")) {
print "This copy of gnuplot does not support polar gridding"
exit # return to caller
}
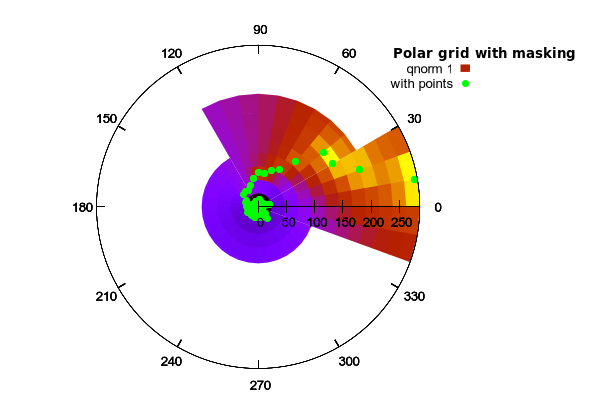
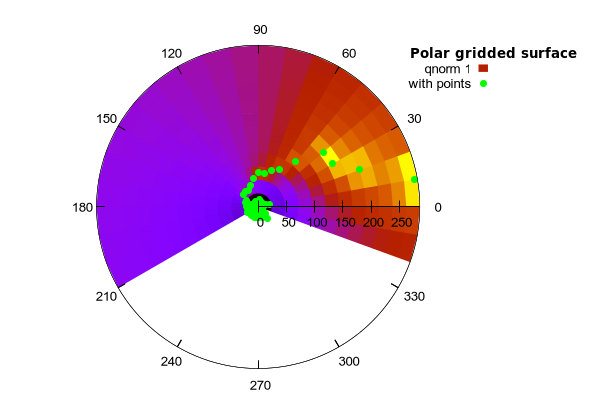
set key rmargin vertical top title "Polar gridded surface" font ":Bold"
set key samplen 0.5
set lmargin 5
set rmargin screen 0.7
set ang degree
set polar
set polar grid 36,12 theta [-20:210]
set rrange [*:*] noextend
set isotropic
set tics front
unset xtics
unset ytics
set rtics 50
set ttics 0,30,330
set border 0 polar
unset colorbox
plot 'silver.dat' using 1:2:3 with surface title "qnorm 1", \
'' using 1:2:3 with points pt 7 lc "green" title "with points"
show polar
show rrange
Click here for minimal script to generate this plot