Back to demo index

gnuplot demo script: zeta.dem

autogenerated by webify.pl on Sun Sep 17 19:56:16 2023
gnuplot version gnuplot 6.0 patchlevel rc2
#
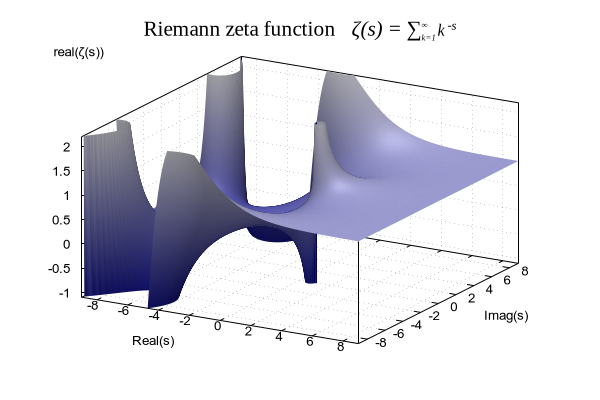
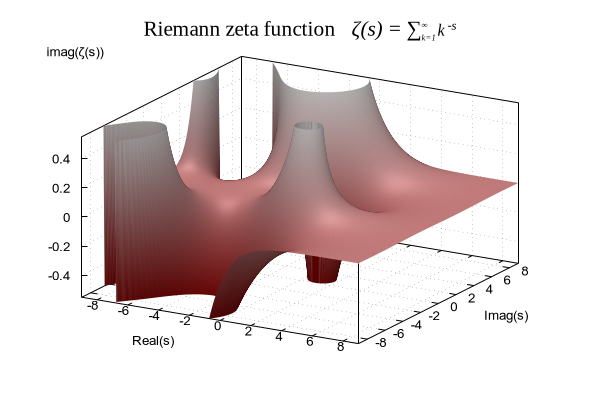
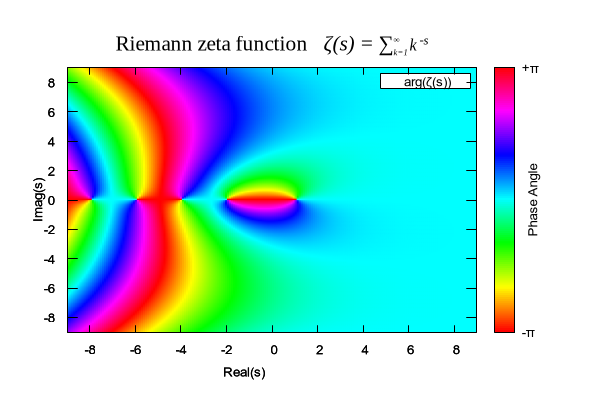
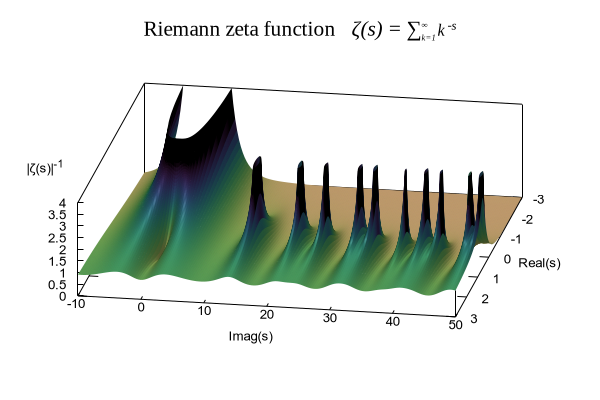
# Riemann zeta fuction
#
# Check support
if (!strstrt(GPVAL_COMPILE_OPTIONS, "+COMPLEX_FUNC")) {
    print "This copy of gnuplot does not provide zeta(s)"
    exit  # return to caller
}
save_encoding = GPVAL_ENCODING
set encoding utf8

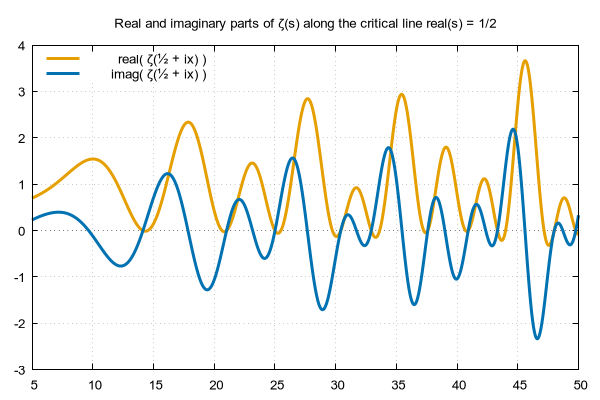
set title "Real and imaginary parts of ζ(s) along the critical line real(s) = 1/2"
set grid x y
set xzeroaxis
set sample 999
set key reverse left
set xrange [5:50]
set yrange [-3:4]

plot real(zeta( 0.5 + I*x )) lt 4 lw 3 title "real( ζ(½ + ix) )", \
     imag(zeta( 0.5 + I*x )) lt 6 lw 3 title "imag( ζ(½ + ix) )"


Click here for minimal script to generate this plot


set title "{/Times=16 Riemann zeta function}    {/Times:Italic=16 ζ(s) = {∑@_{/*0.5 {k=1}}^{/*.5 ∞}}  {/:Italic=12 k^{ -s}}"

set samp 201
set iso 201

set pm3d depth base noborder
set pm3d interp 2,2
set pm3d lighting specular 0.1
set xyplane 0
unset colorbox
set key left
set border 895
set grid x y z vertical

set xlabel "Real(s)" offset -1,0 right
set ylabel "Imag(s)"

set xrange [-9 : 9]
set yrange [-9 : 9]
set zrange [0 : 4]

set palette defined (0 "dark-blue", 1 "white")
set zrange [-1.1 : 2.2]
splot real( zeta(x + I*y) ) with pm3d title "real(ζ(s))"

Click here for minimal script to generate this plot


set palette defined (0 "dark-red", 1 "white")
set zrange [-0.55 : 0.55]
splot imag( zeta(x + I*y) ) with pm3d title "imag(ζ(s))"

Click here for minimal script to generate this plot


set zrange [*:*]
unset grid
set view map
set key right opaque box samplen 0
set colorbox
set cblabel "Phase Angle"
set cblabel  offset -1, 0, 0  rotate
set cbrange [ -3.14159 : 3.14159 ] noreverse writeback
set cbtics   ("-π" -pi, "+π" pi)
set pm3d interp 1,1 nolighting corners2color c1
set palette color model HSV defined ( 0 0 1 1, 1 1 1 1 )

splot arg( zeta(x + I*y) ) with pm3d title "arg(ζ(s))"

Click here for minimal script to generate this plot


unset colorbox
set palette cubehelix negative
set pm3d lighting specular 0.1
set yrange [-10:50]
set xrange [-3:3]
set zrange [0:4]
set view 57, 100, 1.2, 0.5
set key nobox noopaque bottom left at screen 0.0, 0.6
set xlabel offset -3
splot 1./abs( zeta(x + I*y) ) with pm3d title "|ζ(s)|^{-1}"

Click here for minimal script to generate this plot


set encoding save_encoding