#
# This script demonstrates using rescaled image to fill an arbitrary
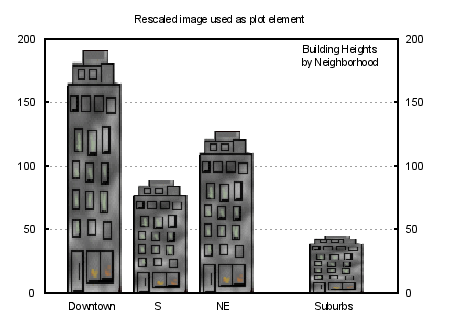
# rectangle. In this case we use it to fill the bars in a bar chart.
# E A Merritt - Sept 2009
#
set termoption lw 2
set title "Rescaled image used as plot element"
set xrange [ -10 : 150 ]
set yrange [ 0 : 200 ]
set y2range[ 0 : 200 ]
set y2tics
set grid y lw 0.5
set key title "Building Heights\nby Neighborhood"
set key nobox
set xtics ("NE" 72.0, "S" 42.0, "Downtown" 12.0, "Suburbs" 122.0) scale 0.0
plot 'bldg.png' binary filetype=png origin=(0,0) dx=0.5 dy=1.5 with rgbimage notitle, \
'bldg.png' binary filetype=png origin=(60,0) dx=0.5 dy=1 with rgbimage notitle, \
'bldg.png' binary filetype=png origin=(30,0) dx=0.5 dy=0.7 with rgbimage notitle, \
'bldg.png' binary filetype=png origin=(110,0) dx=0.5 dy=0.35 with rgbimage notitle
Click here for minimal script to generate this plot
