|
#
#  Textcolor in 3D (req. pm3d)
#
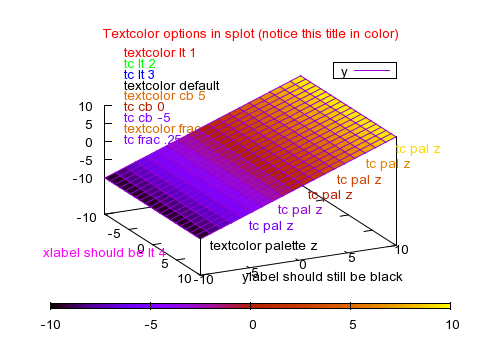
set title "Textcolor options in splot (notice this title in color)" tc lt 1
set samples 20; set isosamples 20
set autoscale
set key box
set pm3d at s
set colorbox horiz user origin .1,.12 size .8,.015
set view 58, 64, 0.83
set xrange [-10:10]
set yrange [-10:10]
set zrange [-10:10]
#
# Test labels
#
set label 1 "textcolor palette z" at 12,-10,-10  nopoint  tc pal z
set label 3 "tc pal z" at 12, -6, -6  nopoint  tc pal z
set label 4 "tc pal z" at 12, -3, -3  nopoint  tc pal z
set label 5 "tc pal z" at 12, -0,  0  nopoint  tc pal z
set label 6 "tc pal z" at 12,  3,  3  nopoint  tc pal z
set label 7 "tc pal z" at 12,  6,  6  nopoint  tc pal z
set label 8 "tc pal z" at 12,  9,  9  nopoint  tc pal z
#
set xlabel 'xlabel should be lt 4' tc lt 4
set cblabel 'color cblabel' textcolor lt 3
#
set label 10 "textcolor lt 1" at -10,-8,24  front nopoint tc lt 1
set label 11 "tc lt 2"    at -10,-8,21  front nopoint tc lt 2
set label 12 "tc lt 3"    at -10,-8,18  front nopoint tc lt 3
set label 13 "textcolor default" at -10,-8,15  front nopoint tc def
set label 14 "textcolor cb 5"   at -10,-8,12  front nopoint tc pal cb 5
set label 15 "tc cb 0"    at -10,-8,9  front nopoint tc pal cb 0
set label 16 "tc cb -5"    at -10,-8,6  front nopoint tc pal cb -5
set label 17 "textcolor frac .75" at -10,-8,3  nopoint tc pal frac .75
set label 18 "tc frac .25" at -10,-8,0  nopoint tc pal frac .25
#
set ylabel 'ylabel should still be black'
#set zlabel 'zlabel should have yet another color' tc lt 2
#
splot y
#

Click here for minimal script to generate this plot
|


