Back to demo index

gnuplot demo script: tics.dem

autogenerated by webify.pl on Sun Feb 12 19:55:47 2012
gnuplot version gnuplot 4.6 patchlevel 0
#
# $Id: tics.dem,v 1.1 2005/08/05 15:53:23 mikulik Exp $
#
# demo for tics settings

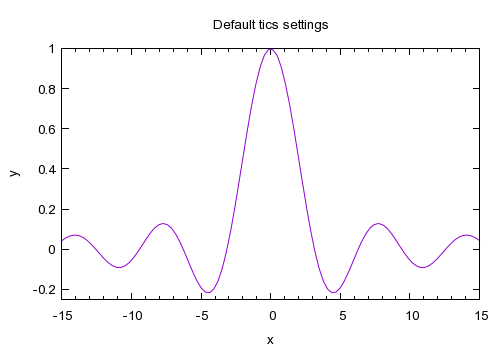
set xlabel "x"
set ylabel "y"
set mxtics

set title "Default tics settings"
set xrange [-15:15]
set yrange [-0.25:1]
plot sin(sqrt(x**2))/sqrt(x**2) notitle

Click here for minimal script to generate this plot
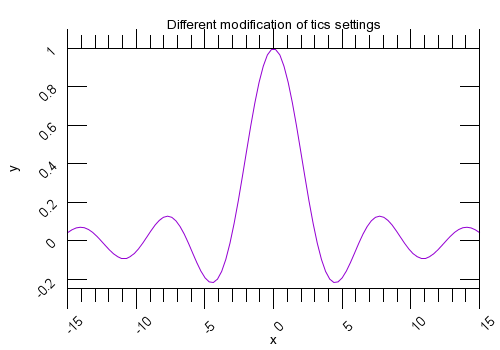


set title "Different modification of tics settings"
set tics scale 3,2 rotate by 45
set xtics out offset 0,-1.0
replot

Click here for minimal script to generate this plot


set xtics textcolor rgb "red" norotate
set ytics rotate by 90 offset 2,0
replot

Click here for minimal script to generate this plot
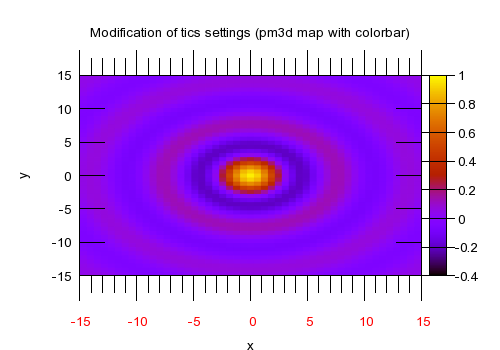


set title "Modification of tics settings (pm3d map with colorbar)"
set pm3d map
set border 4095
set samples 25
set isosamples 20
set palette color positive
set samples 50; set isosamples 50
set tics norotate nooffset
set cbtics in scale 4
set xrange [-15:15]
set yrange [-15:15]
set zrange [-0.25:1]
splot sin(sqrt(x**2+y**2))/sqrt(x**2+y**2) notitle

Click here for minimal script to generate this plot


print "End of tics demo."