#
# $Id: multiaxis.dem,v 1.1 2007/06/09 22:10:45 sfeam Exp $
#

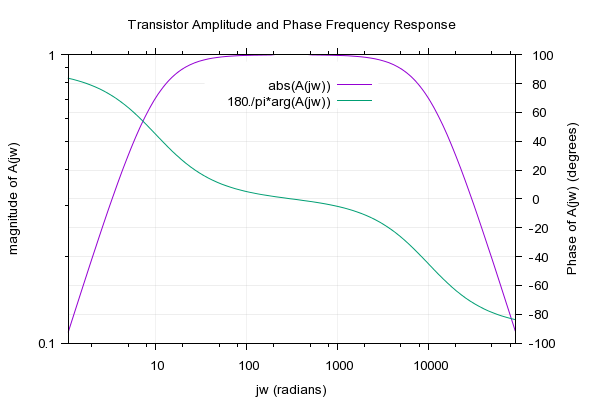
# Use the 3rd plot of the electronics demo to show off
# the use of multiple x and y axes in the same plot.
#
A(jw) = ({0,1}*jw/({0,1}*jw+p1)) * (1/(1+{0,1}*jw/p2))
p1 = 10
p2 = 10000
set dummy jw
set grid x y2
set key center top title " "
set logscale xy
set log x2
unset log y2
set title "Transistor Amplitude and Phase Frequency Response"
set xlabel "jw (radians)"
set xrange [1.1 : 90000.0]
set x2range [1.1 : 90000.0]
set ylabel "magnitude of A(jw)"
set y2label "Phase of A(jw) (degrees)"
set ytics nomirror
set y2tics
set tics out
set autoscale  y
set autoscale y2
plot abs(A(jw)) axes x1y1, 180./pi*arg(A(jw)) axes x2y2


Click here for minimal script to generate this plot
