Back to demo index

gnuplot demo script: param.dem

autogenerated by webify.pl on Sat Jan 11 10:07:36 2014
gnuplot version gnuplot 4.7 patchlevel 0
#
# $Id: param.dem,v 1.6 2014/01/11 05:35:46 sfeam Exp $
#
# Show some of the new parametric capabilities.
#
set parametric
set dummy t
set autoscale
set samples 160
set title ""
set key box
set key below
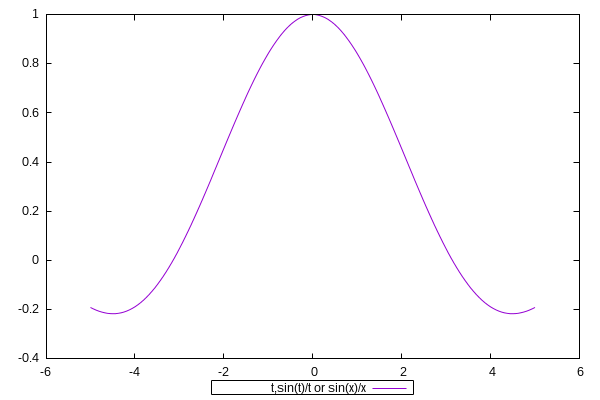
plot t,sin(t)/t title "t,sin(t)/t or sin(x)/x"

Click here for minimal script to generate this plot


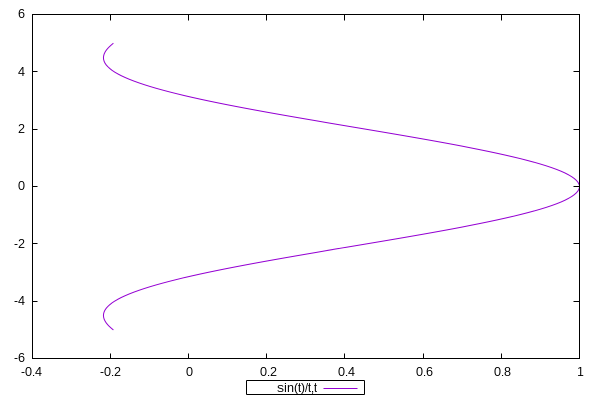
plot sin(t)/t,t

Click here for minimal script to generate this plot


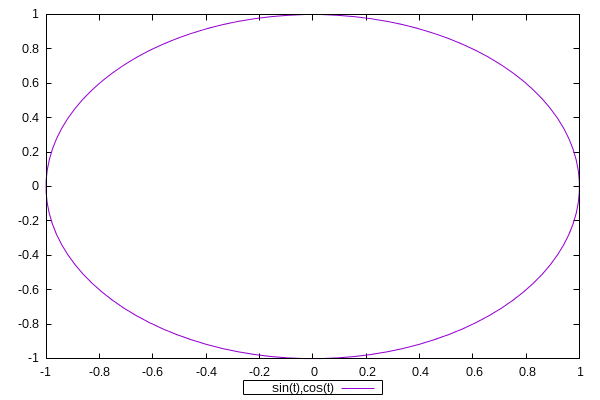
plot sin(t),cos(t)

Click here for minimal script to generate this plot


set xrange [-3:3]
set yrange [-3:3]
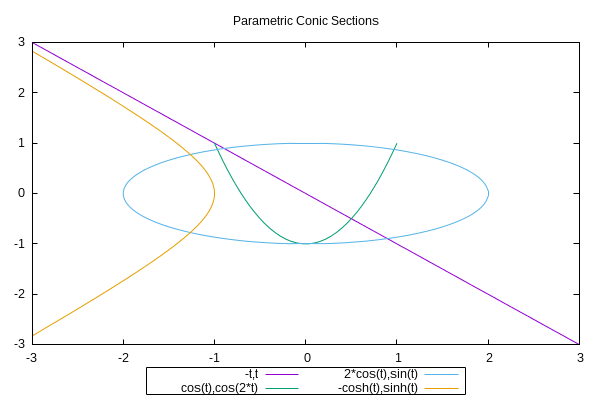
set title "Parametric Conic Sections"
plot -t,t,cos(t),cos(2*t),2*cos(t),sin(t),-cosh(t),sinh(t)
set title ""

Click here for minimal script to generate this plot


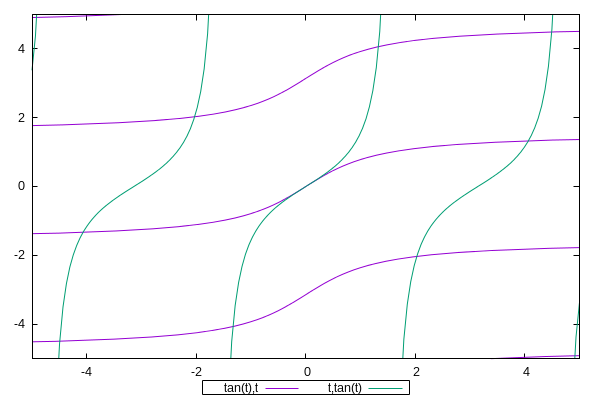
set xrange [-5:5]
set yrange [-5:5]
plot tan(t),t,t,tan(t)

Click here for minimal script to generate this plot


set trange [0.00001:3]
plot t,log(t),-t,log(t),sin(t),t**2,-sin(t),t**2

Click here for minimal script to generate this plot


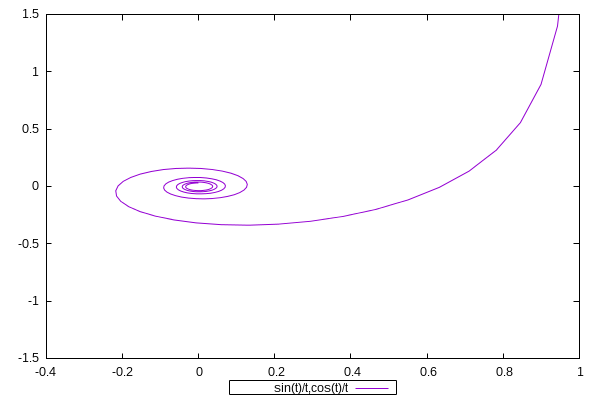
set autoscale x
set yrange [-1.5:1.5]
set trange [0.0001:10*pi]
plot sin(t)/t,cos(t)/t

Click here for minimal script to generate this plot


#
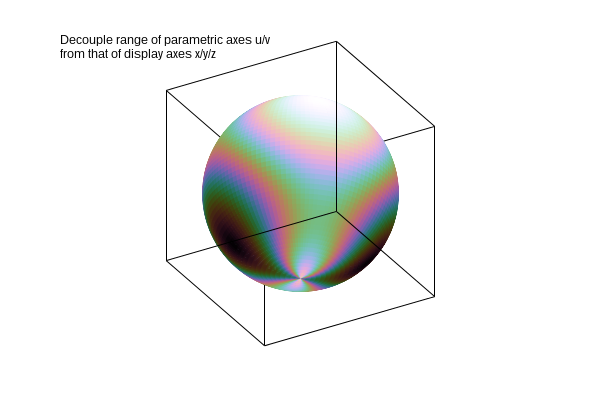
# Decouple range of parametric axes u/v from that of display axes x/y/z
#
set label 1 "Decouple range of parametric axes u/v\nfrom that of display axes x/y/z"
set label 1 at screen 0.1, 0.9
unset colorbox
set palette cubehelix cycle 3
set view equal xyz
set view 120, 300
set xyplane 0
set pm3d depthorder
set border 4095
set tics scale 0
set format ""
set angles radians
xx(u, v) = cos(v) * cos(u)
yy(u, v) = cos(v) * sin(u)
zz(u, v) = sin(v)
color(u, v) = sin(2*u)+sin(2*v)
#
set parametric
set isosamples 121, 61
set samples 121, 61
set urange [-pi:pi] 
set vrange [-pi/2:pi/2]
set xrange [-1:1] 
set yrange [-1:1]
set zrange [-1:1]
splot "++" using (xx($1,$2)):(yy($1,$2)):(zz($1,$2)):(color($1,$2)) with pm3d notitle

Click here for minimal script to generate this plot


# undo what we've done above