#
# jitter.dem
#
# Generate a reusable set of N random data points.
nsamp = 160
set print $random
do for [i=1:nsamp] {
print sprintf("%8.5g %8.5g", invnorm(rand(0)), 100.*invnorm(rand(0)))
}
unset print
#
set border 2
set xrange [-1.5:1.4]
set xtics ("A" -1, "B" 0, "C" 1)
set xtics nomirror scale 0
set ytics nomirror rangelimited
set multiplot layout 1,2
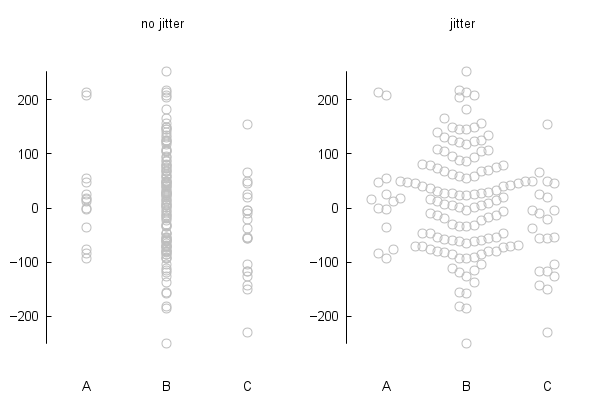
unset jitter
set title "no jitter"
set style data point
plot $random using (int($1)%20):2 notitle pt 6 ps 1.5 lc "gray"
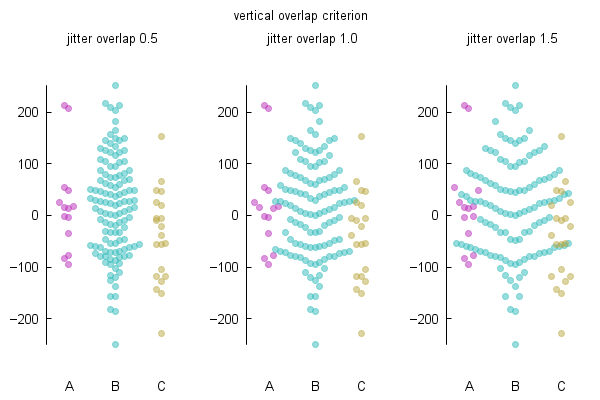
set jitter
set title "jitter"
plot $random using (int($1)%20):2 notitle pt 6 ps 1.5 lc "gray"
unset multiplot
Click here for minimal script to generate this plot