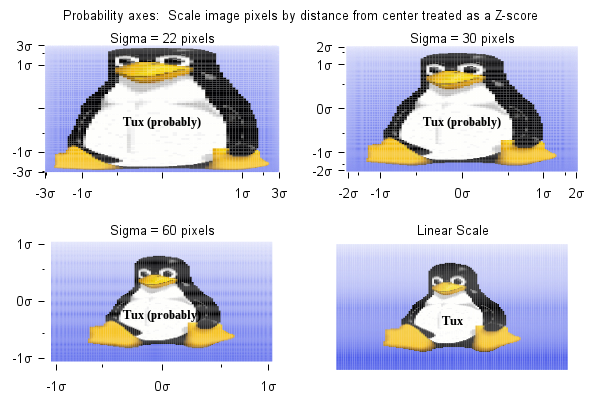
# This example shows how a nonlinear axis definition can be used to # set up "probability axis" scaling on both the x and y axes. # This is also known as "probit" scaling. # We compare 3 treatments of an image file (Tux). # They differ in the sigma value defining the normal distribution curve # used for scaling. # The 4th plot shows the original, unscaled image using linear axes. # unset border set title offset 0,-1 set multiplot layout 2,2 title "Probability axes: Scale image pixels by distance from center treated as a Z-score" set title "Sigma = 22 pixels" sigma = 22. ticinterval = 2 load 'probably_tux.dem' set title "Sigma = 30 pixels" sigma = 30. ticinterval = 1 load 'probably_tux.dem' set title "Sigma = 60 pixels" sigma = 60. load 'probably_tux.dem' set title "Linear Scale" set label 1 "Tux" set xlabel " " set ylabel " " unset nonlinear x unset nonlinear y unset xtics unset ytics replot unset multiplotClick here for minimal script to generate this plot
