#
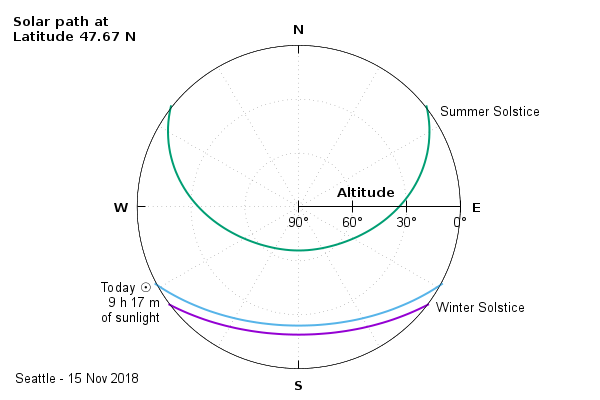
# Calculate solar path in horizontal coordinates (altitude, azimuth)
# Use gnuplot's polar mode with inverted R range so that the horizon
# (altitude 0°) is at the perimeter and altitude 90° is at the center.
#

save_encoding = GPVAL_ENCODING
set encoding utf8

set label 1 at screen 0.02, 0.95 font ":Bold,10"
set label 1 "Solar path at\nLatitude 47.67 N"
set timestamp "Seattle - %d %b %Y" offset 1,1

# Set up equations for Azimuth(t) and Altitude(t) as a function of
# t = seconds  before or after solar noon on the day of interest
# at a particular latitude.
# Here we calculate for Seattle (47.67 N  -122.28 W)

  Latitude = 47.67
  Longitude = -122.28
  Date = "21-12-2016"
  call 'solar_params.dem'

  array dummy[150]
  array winter_alt[150]; array winter_azi[150]
  time = -12 * Hour
  do for [t = 1 : 150] {
	winter_alt[t] = Altitude(time)
	winter_azi[t] = Azimuth(time)
	time = time + 10 * Minute
  }
  print Date, "    sunrise ", sunrise, "   sunset ", sunset, "    sunlight ", sunlight

  Date = "22-06-2017"
  call 'solar_params.dem'

  array summer_alt[150]; array summer_azi[150]
  time = -12 * Hour
  do for [t = 1 : 150] {
	summer_alt[t] = Altitude(time)
	summer_azi[t] = Azimuth(time)
	time = time + 10 * Minute
  }
  print Date, "    sunrise ", sunrise, "   sunset ", sunset, "    sunlight ", sunlight

  Date = strftime("%d-%m-%Y",time(0) + Day*Longitude/360.)
  call 'solar_params.dem'

  array today_alt[150]; array today_azi[150]
  time = -12 * Hour
  do for [t = 1 : 150] {
	today_alt[t] = Altitude(time)
	today_azi[t] = Azimuth(time)
	dummy[t] = time
	time = time + 10 * Minute
  }
  print Date, "    sunrise ", sunrise, "   sunset ", sunset, "    sunlight ", sunlight
  today = "Today ☉  \n".sunlight."\nof sunlight"

#
set angle degrees

set polar
set grid polar
unset xtics
unset ytics
unset border
unset key
set size square
set rrange [90:0]

set ttics add ("N" 0, "E" 90, "S" 180, "W" -90) font ":Bold"
set rtics format "%.0f°"
set rtics 30
set rlabel "Altitude" offset -2 font ":Bold"
set border polar
set style data lines

# By convention North (azimuth 0°) is at the top with angles increasing clockwise
set theta top clockwise

plot dummy using (winter_azi[$1]):(winter_alt[$1]) lw 2 title "   Winter Solstice" at beg left, \
     dummy using (summer_azi[$1]):(summer_alt[$1]) lw 2 title "   Summer Solstice" at beg left, \
     dummy using (today_azi[$1]):(today_alt[$1]) lw 2 title today at end right


Click here for minimal script to generate this plot
