Back to demo index

gnuplot demo script: cerf.dem

autogenerated by webify.pl on Sat Mar 11 15:38:16 2023
gnuplot version gnuplot 5.4 patchlevel 7alpha
#
# Exercise the special functions in external library libcerf.
# These are only present if libcerf was found during configuration/build
# of the current gnuplot executable.
#
if (!strstrt(GPVAL_COMPILE_OPTIONS,"+LIBCERF")) {
	print  "This copy of gnuplot was not linked against libcerf"
	exit;
}

save_encoding = GPVAL_ENCODING
set encoding utf8

set title "Voigt Profile VP(x,σ,γ)"
set xrange [-10:10]
set yrange [0.0:0.3]
set xtics out nomirror
set ytics in mirror format "%.2f"
set mxtics
set mytics
set sample 200

plot VP(x,1.53,0.0) title "σ=1.53 γ=0.00", \
     VP(x,1.30,0.5) title "σ=1.30 γ=0.50", \
     VP(x,1.00,1.0) title "σ=1.00 γ=1.00", \
     VP(x,0.00,1.8) title "σ=0.00 γ=1.80"


Click here for minimal script to generate this plot
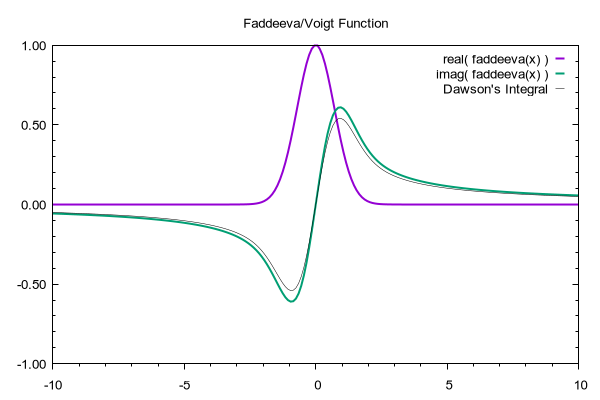


set yrange [-1:1]
set title "Faddeeva/Voigt Function"
set key samplen 0.5

plot real( faddeeva(x) ) lw 2, \
     imag( faddeeva(x) ) lw 2, \
     real(cdawson(x)) lt -1 lw 0.5 title "Dawson's Integral"


Click here for minimal script to generate this plot
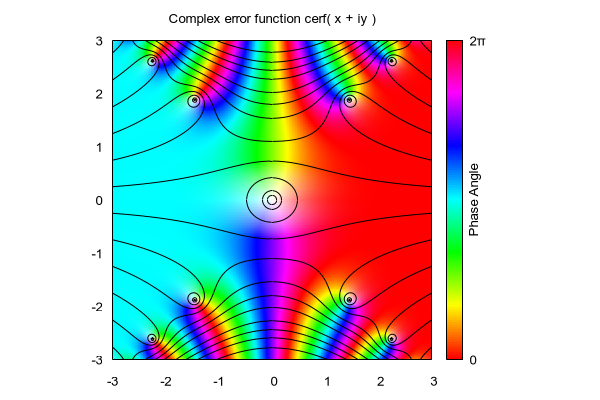


unset key
set view map
set bmargin at screen 0.1
set tmargin at screen 0.9
set sample 200
set isosamples 200, 200
set size ratio 1 1,1
set cbtics   ("0" -pi, "2π" pi)
set title "Complex error function cerf( x + iy )" 
set auto xy
set urange [ -3 : 3 ]
set vrange [ -3 : 3 ]
set tics scale 0
set cblabel "Phase Angle" 
set cblabel  offset character -2, 0, 0 font "" textcolor lt -1 rotate by -270
set cbrange [ -pi : pi ] noreverse nowriteback

set contour
set cntrparam levels discrete 0.1, 0.2, 0.5,  1, 2, 5,  10, 20, 50,  100, 200, 500
set cntrlabel onecolor

set palette positive nops_allcF maxcolors 0 gamma 1.5 color model HSV 
set palette defined ( 0 0 1 1, 1 1 1 1 )

Hue(x,y) = (pi + atan2(-y,-x)) / (2*pi)
phase(x,y) = hsv2rgb( Hue(x,y), sqrt(x**2+y**2), 1. )
rp(x,y) = real(f(x,y))
ip(x,y) = imag(f(x,y))
color(x,y) = hsv2rgb( Hue( rp(x,y), ip(x,y) ), abs(f(x,y)), 1. )
f(x,y) = cerf(x+y*{0,1})

splot '++' using 1:2:(color($1,$2)) with pm3d lc rgb variable nocontour, \
      '++' using 1:2:(abs(cerf($1+$2*{0,1}))) with lines nosurf lt -1


Click here for minimal script to generate this plot


set encoding save_encoding