Back to demo index

gnuplot demo script: spiderplot.dem

autogenerated by webify.pl on Sat Mar 11 15:39:30 2023
gnuplot version gnuplot 5.4 patchlevel 7alpha
# 
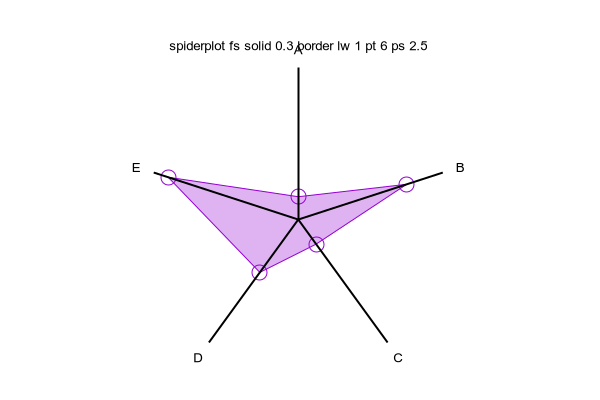
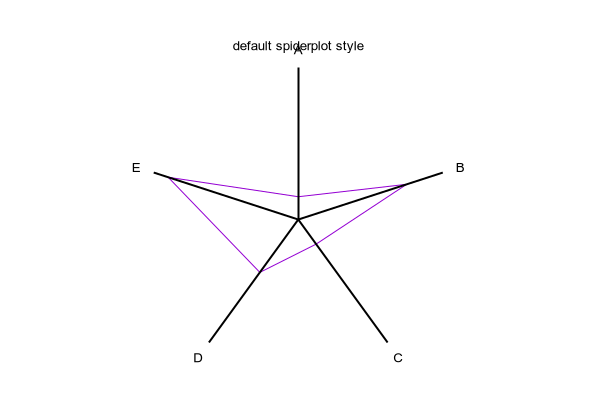
# exercise spiderplot options
#
$DATA << EOD
A	B	C	D	E	F
15	75	20	43	90	50
EOD

set spiderplot
set for [i=1:10] paxis i range [0:100]

set title "default spiderplot style"
plot for [i=1:5] $DATA using i title columnhead

Click here for minimal script to generate this plot


set title "spiderplot fillstyle solid 0.2 noborder"
set style spiderplot fillstyle solid 0.2 noborder
replot

Click here for minimal script to generate this plot


set title "spiderplot fs solid 0.3 border lw 3.0"
set style spiderplot fs solid 0.3 border lw 3.0
replot

Click here for minimal script to generate this plot


set title "spiderplot fs solid 0.3 border lw 1 pt 6 ps 2.5"
set style spiderplot fs solid 0.3 border lw 1 pt 6 ps 2.5
replot

Click here for minimal script to generate this plot


set title "set for [p=1:5] paxis p tics font ',9' "
set for [i=1:5] paxis i tics font ',9'
replot

Click here for minimal script to generate this plot


array Array1 = [ 15, 75, 20, 43, 90, 50 ]
array Array2 = [ 25, 25, 50, 50, 75, 50 ]

set title "spiderplot from data array, show grid"
set style spiderplot fs transparent solid 0.2 border lw 1 pt 6 ps 2
set for [i=2:6] paxis i tics format ""

set grid spider lt black lc "grey" lw 0.5 back
plot for [i=1:|Array1|] Array1 using (Array1[i]) lc 3 lw 3 title sprintf("Scale %d",i)

Click here for minimal script to generate this plot


set title "To plot from 2 different files or arrays, use 'newspiderplot'"
set key reverse
set grid spider
plot \
     keyentry with spiderplot lc 3 lw 3 title "Array #1", \
     for [i=1:|Array1|] Array1 using (Array1[i]) lc 3 lw 3 title sprintf("Scale %d",i), \
     newspiderplot, \
     keyentry with spiderplot lc 4 lw 2 title "Array #2", \
     for [j=1:|Array2|] Array2 using (Array2[j]) lc 4 lw 2 notitle


Click here for minimal script to generate this plot