Back to demo index

gnuplot demo script: BesselK.dem

autogenerated by webify.pl on Fri Dec 20 14:48:32 2024
gnuplot version gnuplot 6.0 patchlevel 2
#
#
#
# Check support for BesselK
if (!strstrt(GPVAL_COMPILE_OPTIONS, "+AMOS")) {
    print "This copy of gnuplot does not support BesselK"
    exit  # return to caller
}

save_encoding = GPVAL_ENCODING
set encoding utf8

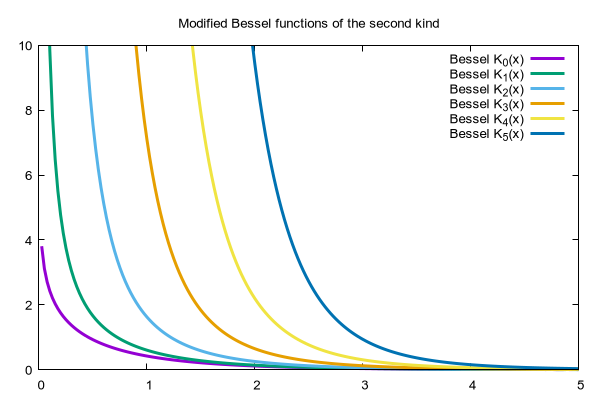
set xrange [0:5]
set yrange [0:10]
set sample 201

set title "Modified Bessel functions of the second kind"
plot for [K=0:5] BesselK(K,x) lw 3 title sprintf("Bessel K_{%d}(x)",K)


Click here for minimal script to generate this plot
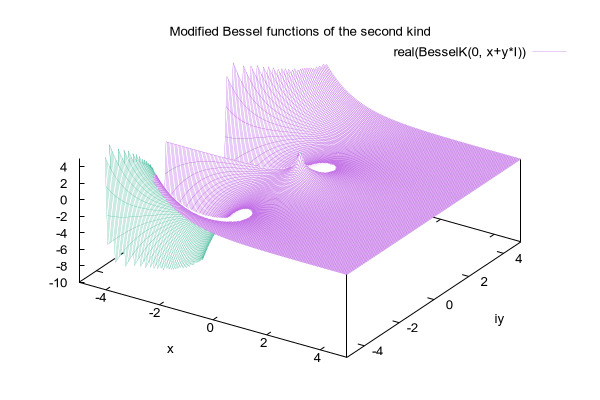


set xrange [-5:5]
set yrange [-5:5]
set zrange [-10:5]
set xyplane 0
set view 42, 33
set xlabel "x"
set ylabel "iy"
set hidden3d
unset colorbox
set sample 201
set isosample 201

splot real(BesselK(0, x+y*I)) with lines lw .2


Click here for minimal script to generate this plot
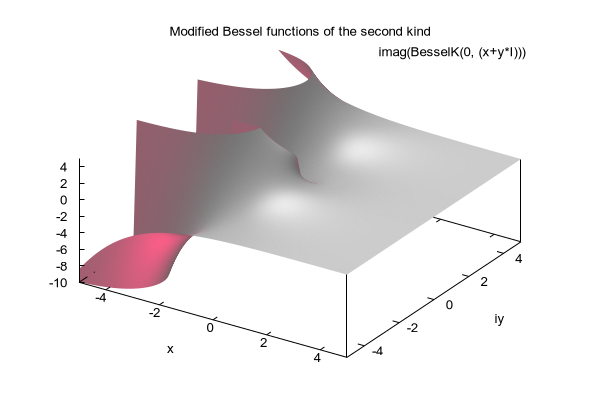


set pm3d lighting spec2 0.6

splot imag(BesselK(0, (x+y*I))) lw .2 with pm3d fc "gray"


Click here for minimal script to generate this plot
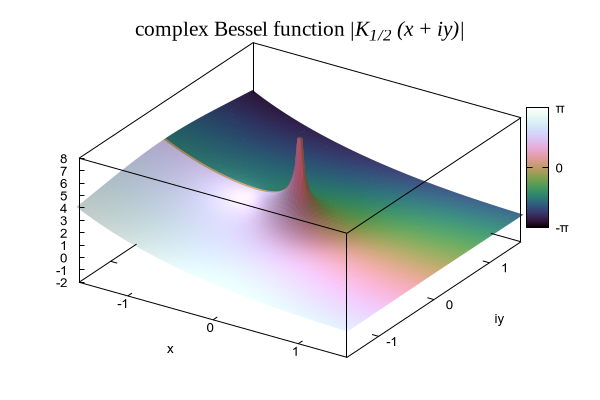


set xrange [-pi/2:pi/2]
set yrange [-pi/2:pi/2]
set zrange [-2:8]
set tics 1
set colorbox
set cbrange [-pi:pi]
set cbtics ("-π" -pi, "0" 0, "π" pi)
set palette cubehelix
set border -1
set xyplane 0
set sample 300
set isosample 300

set title "{/Times=16 complex Bessel function} {/Times:Italic=16 |K_{1/2} (x + iy)|}"
unset key

splot '++' using 1:2:( abs(BesselK( 0.5, x+y*I )) ):( arg(BesselK( 0.5, x+y*I )) ) with pm3d


Click here for minimal script to generate this plot
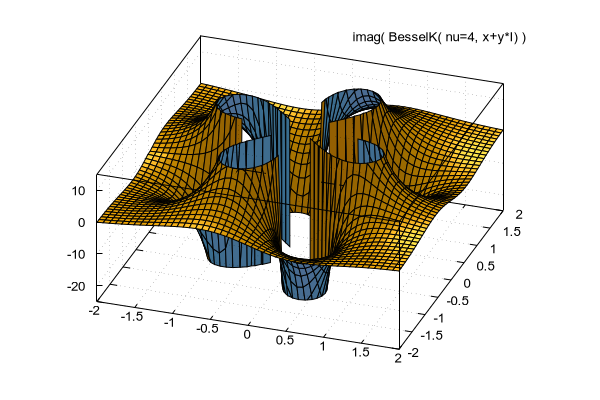


set border -1
set grid x y z vertical
set view 41, 19
set samples 50, 50
set isosamples 50, 50
set hidden3d

set xyplane 0
set ztics  10
set xrange [ -2.0 : 2.0 ]
set yrange [ -2.0 : 2.0 ]
set zrange [ -25. : 15. ]
set pm3d border lt black
set pm3d lighting primary 0.4 specular 0.3 spec2 0.1
unset colorbox

splot imag( BesselK( nu=4, x+y*I) ) with pm3d fc ls 3


Click here for minimal script to generate this plot


set encoding save_encoding