#
# Exercise the special functions in external library libcerf.
# These are only present if libcerf was found during configuration/build
# of the current gnuplot executable.
#
if (!strstrt(GPVAL_COMPILE_OPTIONS,"+LIBCERF")) {
	print  "This copy of gnuplot was not linked against libcerf"
	exit;
}

save_encoding = GPVAL_ENCODING
set encoding utf8

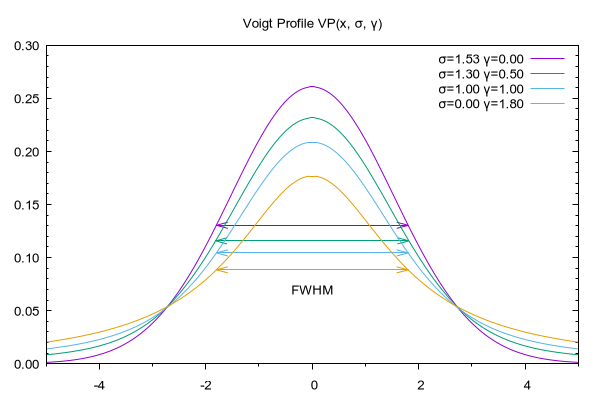
set title "Voigt Profile VP(x, σ, γ)"
set xrange [-5:5]
set yrange [0.0:0.3]
set xtics out nomirror
set ytics in mirror format "%.2f"
set mxtics
set mytics
set sample 200

fwhm1 = VP_fwhm(1.53,0.0)
fwhm2 = VP_fwhm(1.30,0.5)
fwhm3 = VP_fwhm(1.00,1.0)
fwhm4 = VP_fwhm(0.00,1.8)

set style arrow 1 heads # size screen  0.008,90.,90.
set arrow 1 from -fwhm1/2., VP(-fwhm1/2., 1.53, 0.0) to fwhm1/2., VP(fwhm1/2., 1.53, 0.0) as 1 lc 1
set arrow 2 from -fwhm2/2., VP(-fwhm2/2., 1.30, 0.5) to fwhm2/2., VP(fwhm2/2., 1.30, 0.5) as 1 lc 2
set arrow 3 from -fwhm3/2., VP(-fwhm3/2., 1.00, 1.0) to fwhm3/2., VP(fwhm3/2., 1.00, 1.0) as 1 lc 3
set arrow 4 from -fwhm4/2., VP(-fwhm4/2., 0.00, 1.8) to fwhm4/2., VP(fwhm4/2., 0.00, 1.8) as 1 lc 4
set label 1 "FWHM" at 0, 0.07 center

plot VP(x,1.53,0.0) title "σ=1.53 γ=0.00", \
     VP(x,1.30,0.5) title "σ=1.30 γ=0.50", \
     VP(x,1.00,1.0) title "σ=1.00 γ=1.00", \
     VP(x,0.00,1.8) title "σ=0.00 γ=1.80"


Click here for minimal script to generate this plot


