Back to demo index

gnuplot demo script: complex_trig.dem

autogenerated by webify.pl on Fri Dec 20 14:48:27 2024
gnuplot version gnuplot 6.0 patchlevel 2
#
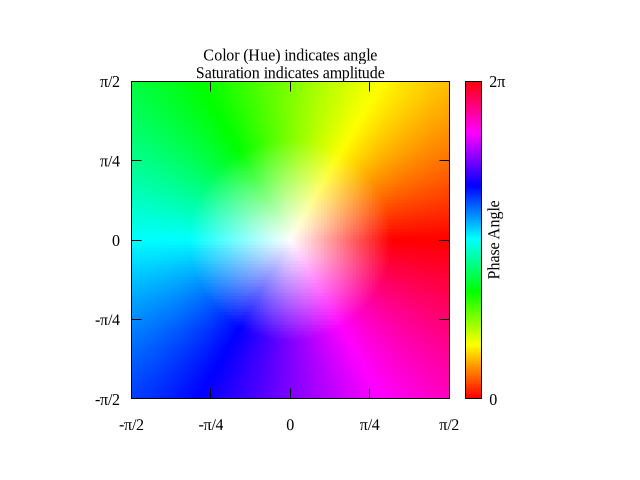
# Set up a color mapping for vectors in the complex plane similar to the one
# used on Wikipedia for plotting complex trigonometric functions.
# HSV colors
#	Hue is the vector angle atan( Real(f) / Imaginary(f) )
#	Saturation is the vector magnitude (length)
#	V = 1
#
save_encoding = GPVAL_ENCODING
set encoding utf8

# We don't use the palette for plotting, but defining it allows us to
# draw a colorbar showing the phase angle color scheme
set palette model HSV defined ( 0 0 1 1, 1 1 1 1 )
set cbrange [-pi : pi]
set cbtics ("0" -pi, "2π" pi)
set cblabel "Phase Angle" rotate offset -2,0

Hue(x,y) = (pi + atan2(-y,-x)) / (2*pi)
phase(x,y) = hsv2rgb( Hue(x,y), sqrt(x**2+y**2), 1. )

set xrange [-pi/2. : pi/2.]
set yrange [-pi/2. : pi/2.]
set urange [-pi/2. : pi/2.]
set vrange [-pi/2. : pi/2.]
set xtics ("-π/2" -pi/2., "-π/4" -pi/4., "0" 0, "π/4" pi/4., "π/2" pi/2.)
set ytics ("-π/2" -pi/2., "-π/4" -pi/4., "0" 0, "π/4" pi/4., "π/2" pi/2.)

set view map; set size square; unset key
set isosamples 100,100

set title "Color (Hue) indicates angle\nSaturation indicates amplitude"
splot '++' using 1:2:(phase($1,$2)) with pm3d lc rgb variable


Click here for minimal script to generate this plot


rp(x,y) = real(f(x,y))
ip(x,y) = imag(f(x,y))
color(x,y) = hsv2rgb( Hue( rp(x,y), ip(x,y) ), abs(f(x,y)), 1. )

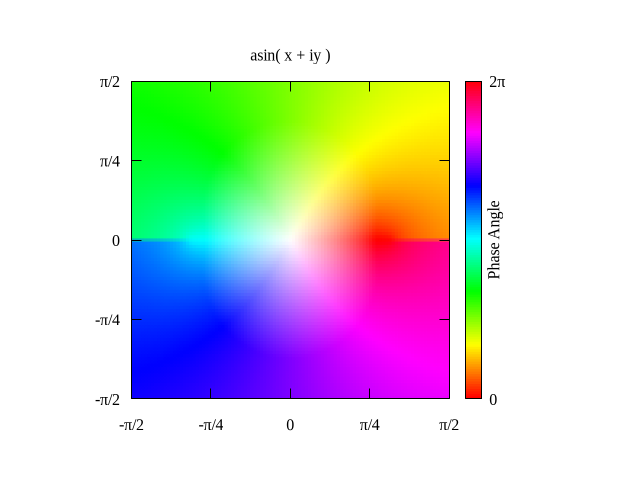
set title "asin( x + iy )"
f(x,y) = asin(x + y*{0,1})
splot '++' using 1:2:(color($1,$2)) with pm3d lc rgb variable

Click here for minimal script to generate this plot
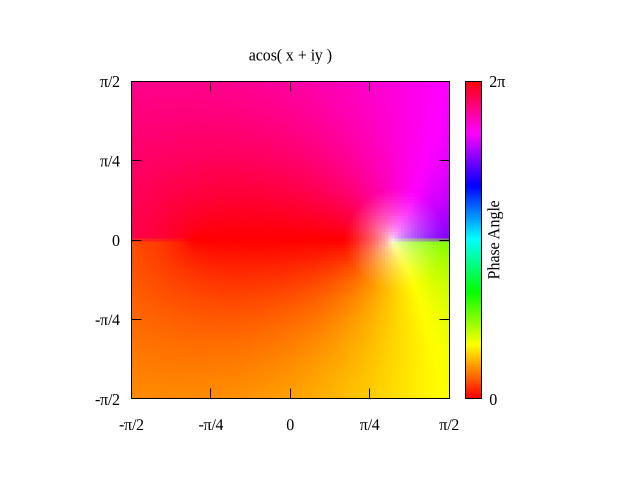


set title "acos( x + iy )"
f(x,y) = acos(x + y*{0,1})
splot '++' using 1:2:(color($1,$2)) with pm3d lc rgb variable

Click here for minimal script to generate this plot
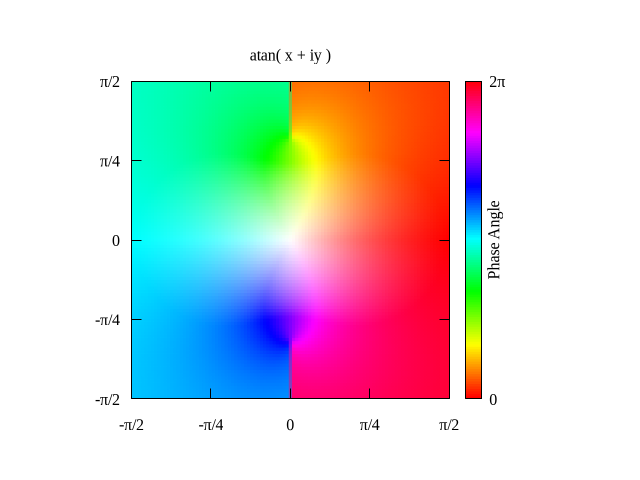


set title "atan( x + iy )"
f(x,y) = atan(x + y*{0,1})
splot '++' using 1:2:(color($1,$2)) with pm3d lc rgb variable

Click here for minimal script to generate this plot
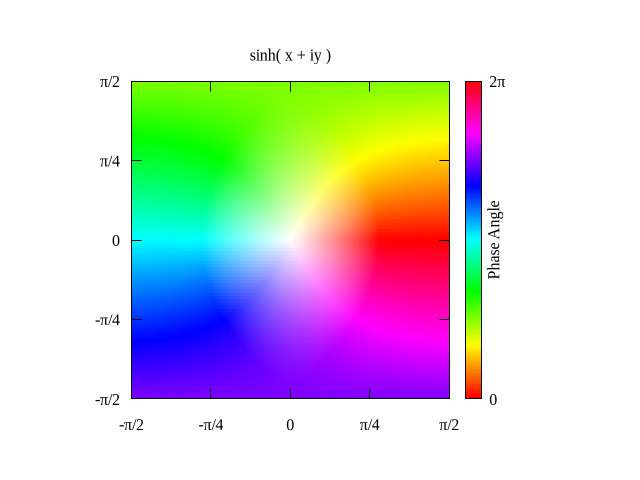


set title "sinh( x + iy )"
f(x,y) = sinh(x + y*{0,1})
splot '++' using 1:2:(color($1,$2)) with pm3d lc rgb variable

Click here for minimal script to generate this plot
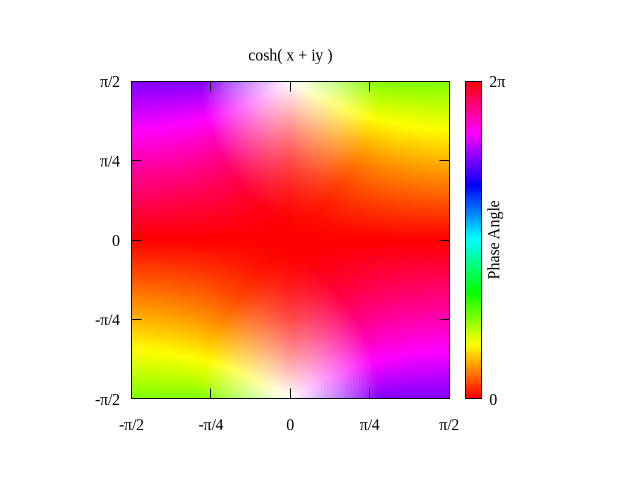


set title "cosh( x + iy )"
f(x,y) = cosh(x + y*{0,1})
splot '++' using 1:2:(color($1,$2)) with pm3d lc rgb variable

Click here for minimal script to generate this plot
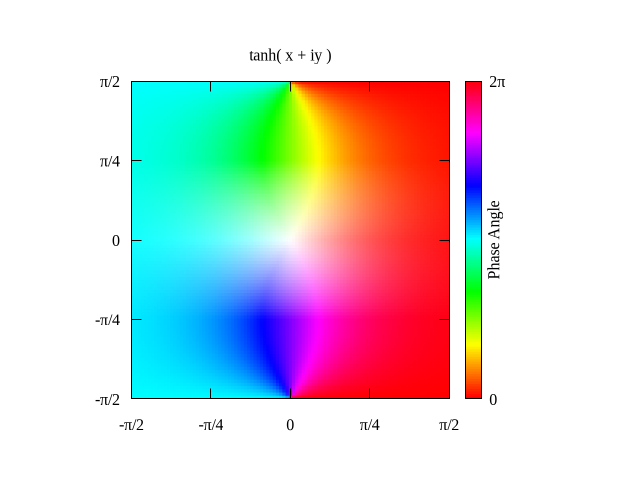


set title "tanh( x + iy )"
f(x,y) = tanh(x + y*{0,1})
splot '++' using 1:2:(color($1,$2)) with pm3d lc rgb variable

Click here for minimal script to generate this plot
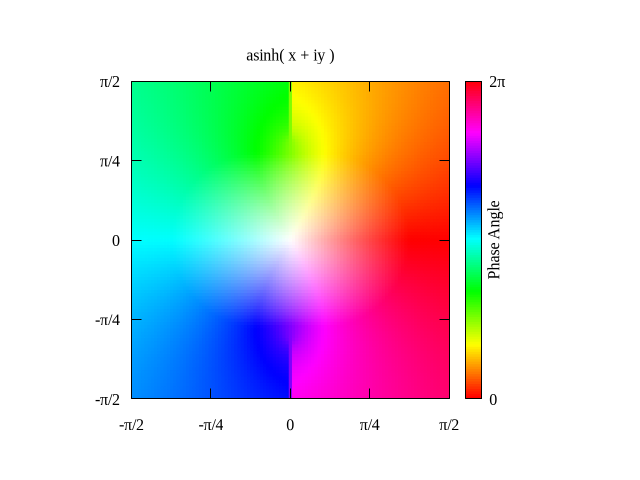


set title "asinh( x + iy )"
f(x,y) = asinh(x + y*{0,1})
splot '++' using 1:2:(color($1,$2)) with pm3d lc rgb variable

Click here for minimal script to generate this plot
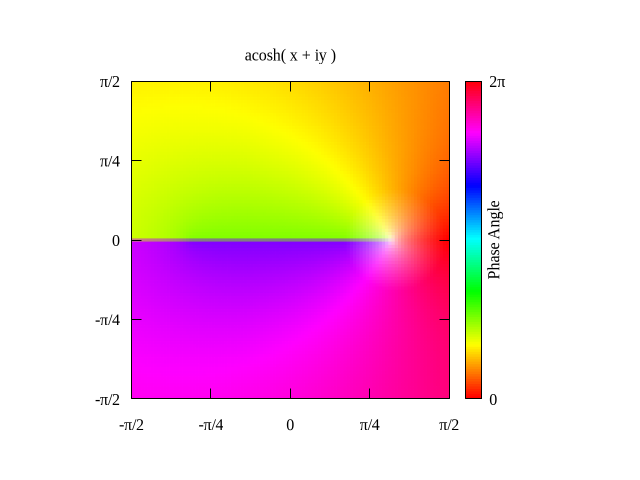


set title "acosh( x + iy )"
f(x,y) = acosh(x + y*{0,1})
splot '++' using 1:2:(color($1,$2)) with pm3d lc rgb variable

Click here for minimal script to generate this plot
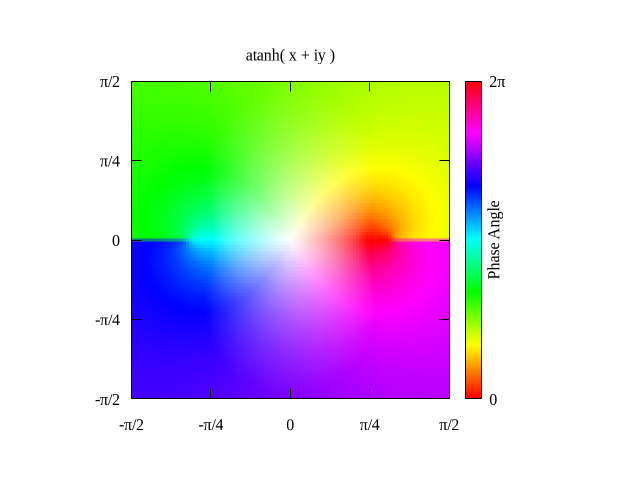


set title "atanh( x + iy )"
f(x,y) = atanh(x + y*{0,1})
splot '++' using 1:2:(color($1,$2)) with pm3d lc rgb variable

Click here for minimal script to generate this plot
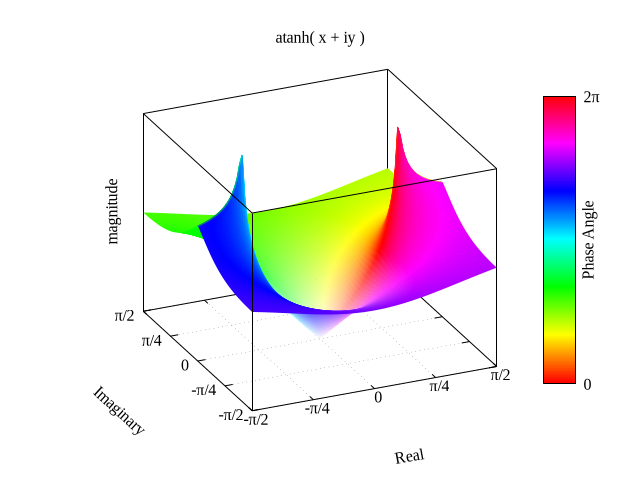


#
# The final plot is atanh() again, but this time we represent
# the magnitude as a z-coordinate.  The angle in the complex
# plane is colored as before.
#

set view 66, 336, 1.2, 1.2
set view equal xyz
set colorbox user origin 0.85, 0.2
unset ztics
set zlabel "magnitude" rotate offset 3
set xlabel "Real" rotate parallel offset 0,-2
set ylabel "Imaginary" rotate parallel offset 0,-2
set grid x y
set xyplane at 0.0
set border -1

splot '++' using 1:2:(abs(f($1,$2))):(color($1,$2)) with pm3d lc rgb variable


Click here for minimal script to generate this plot


#
set encoding save_encoding