#
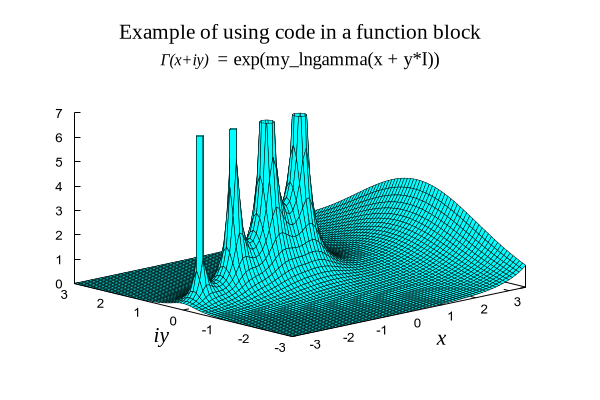
# Demonstrate use of function block definitions to
# implement the complex lngamma(z) function using a 15 term
# Lanczos approximation valid on the half-plane with Real(z) > 0.
# To deal with the other half plane we use the reflection formula
#       Gamma(1-z) = (pi*z) / ( Gamma(1+z) * sin(pi*z) )
#
# This is the same approximation used for gnuplot's built-in
# lnGamma function, but for simplicity it omits checks for pole points at
# z = negative integer and adjustment of the imaginary component
# by multiples of 2pi to produce a continuous 3D surface.
#
# After execution of this script, $Reflect(z), $Lanczos(z), and coef remain
# visible globally.  The coefficient array could be declared local, but then
# the routines defined here would fail to execute outside of this script.
# That is, "load eval_function.dem" works either way,  but a subsequent
# "replot" command outside the script would fail if the coefficients are
# not available globally.
#
# references
#	C. Lanczos, SIAM JNA  1, 1964. pp. 86-96.
#	J. Spouge,  SIAM JNA 31, 1994. pp. 931.
#	W. Press et al, "Numerical Recipes 3rd Edition" Section 6.1.
#
# Ethan A Merritt 2022
#

if (!strstrt(GPVAL_COMPILE_OPTIONS, "+FUNCTIONBLOCKS")) {
    print "This copy of gnuplot does not function blocks"
    exit  # return to caller
}

array coef[15] = [ \
        0.99999999999999709182, \
       57.156235665862923517,    -59.597960355475491248, \
       14.136097974741747174,     -0.49191381609762019978, \
        0.33994649984811888699e-4, 0.46523628927048575665e-4, \
       -0.98374475304879564677e-4, 0.15808870322491248884e-3, \
       -0.21026444172410488319e-3, 0.21743961811521264320e-3, \
       -0.16431810653676389022e-3, 0.84418223983852743293e-4, \
       -0.26190838401581408670e-4, 0.36899182659531622704e-5 ]

function $Reflect(z) << EOD
    local w = $Lanczos(1.0 - z)
    local temp = log( sin(pi * z) )
    return log(pi) - (w + temp)
EOD

function $Lanczos(z) << EOD
    local Sum = coef[1] + sum [k=2:15] coef[k] / (z + k - 1)
    local temp = z + 671./128.
    temp = (z + 0.5) * log(temp) - temp
    temp = temp + log( sqrt(2*pi) * Sum/z )
    return temp
EOD

my_lngamma(z) = (z == 0) ? NaN : (real(z) < 0.5) ? $Reflect(z) : $Lanczos(z)
Gamma(z) = exp( my_lngamma(z) )

show var $
show fun

set xyplane at 0
set xrange [-3.5 : 3.5]
set yrange [-3.0 : 3.0]
set zrange [ 0.0 : 7.0]
set xlabel "{/Times:Italic=16 x}" offset -3,-1
set ylabel "{/Times:Italic=16 iy}" offset 5,-1
set xtics 1 offset 0,-0.5
set ytics 1 offset 0,-0.5
unset key
unset colorbox

set sample 71
set isosample 71
set view 67, 317

set title "Example of using code in a function block" font "Times,16"
set label 1 center at screen 0.5, screen 0.85
set label 1 '{/Times:Italic=12 Γ(x+iy) }{/Times:Normal=14  = exp(my\_lngamma(x + y*I))}'

set pm3d border lt black lw 0.5
splot abs(Gamma(x + y*I)) with pm3d fc "cyan"


Click here for minimal script to generate this plot
