Back to demo index

gnuplot demo script: imageNaN.dem

autogenerated by webify.pl on Fri Dec 20 14:47:01 2024
gnuplot version gnuplot 6.0 patchlevel 2
#
# Explore the effect of image data pixels that are
# missing/NaN/Inf/garbage/...
# Test 2D and 3D versions of the generic and
# terminal-optimized image code.
# The four tests should all come out the same.
#

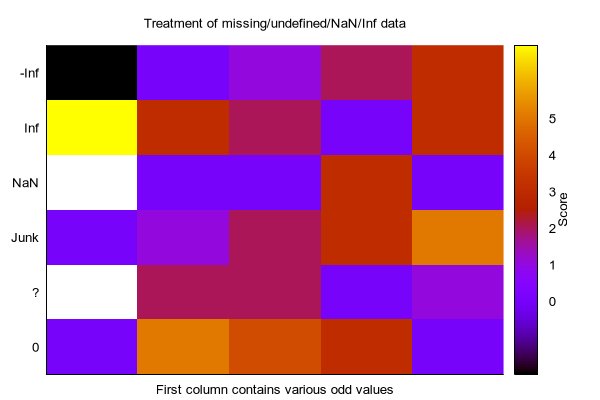
set title "Treatment of missing/undefined/NaN/Inf data"
unset key
set tic scale 0
set border 3 front

set cbrange [-2:7]
set cblabel "Score"
set cbtics 0,1,5

set xrange [-0.5:4.5]
set yrange [-0.5:5.5]

set datafile missing "?"
set ytics ("-Inf" 5, "Inf" 4, "NaN" 3, "Junk" 2, "?" 1, "0" 0)
unset xtics

# Define the test data as a named data block
$matrixdata << EOD
0    5 4 3  0
?    2 2 0  1
Junk 1 2 3  5
NaN  0 0 3  0
Inf  3 2 0  3
-Inf 0 1 2  3
EOD

set xlabel "First column contains various odd values"

set view map
plot $matrixdata matrix with image 


Click here for minimal script to generate this plot


#
#
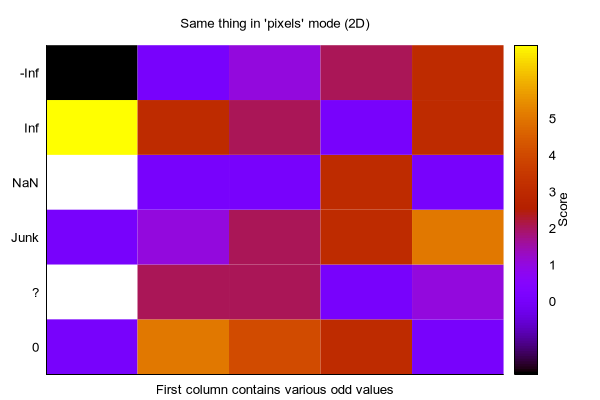
set title "Same thing in 'pixels' mode (2D)"

plot $matrixdata matrix with image pixels


Click here for minimal script to generate this plot
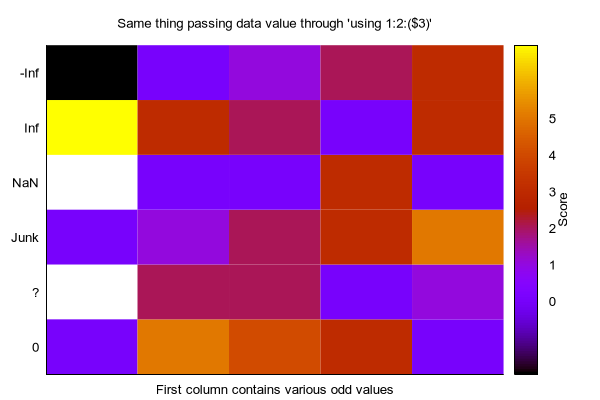


set title "Same thing passing data value through 'using 1:2:($3)'"

plot $matrixdata matrix using 1:2:($3) with image pixels


Click here for minimal script to generate this plot
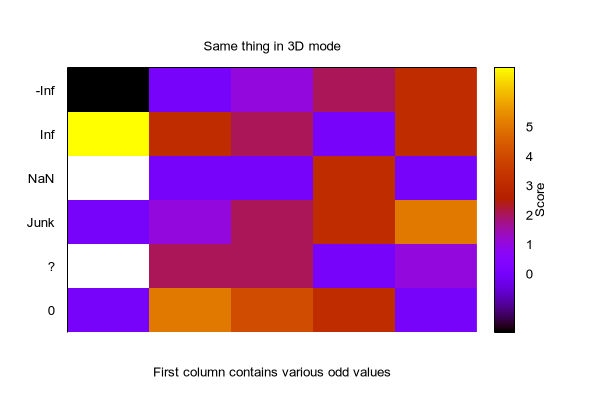


set title "Same thing in 3D mode"

splot $matrixdata matrix with image


Click here for minimal script to generate this plot
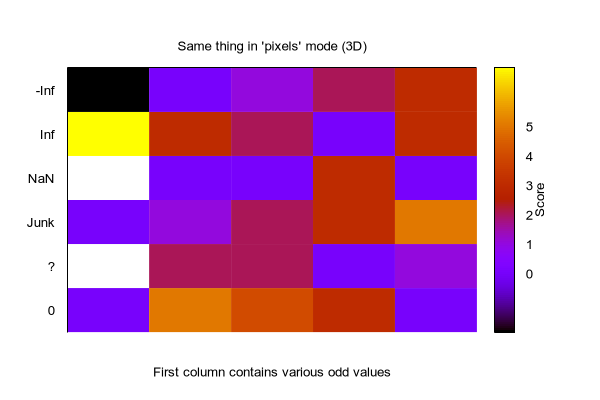


set title "Same thing in 'pixels' mode (3D)"

splot $matrixdata matrix with image pixels


Click here for minimal script to generate this plot
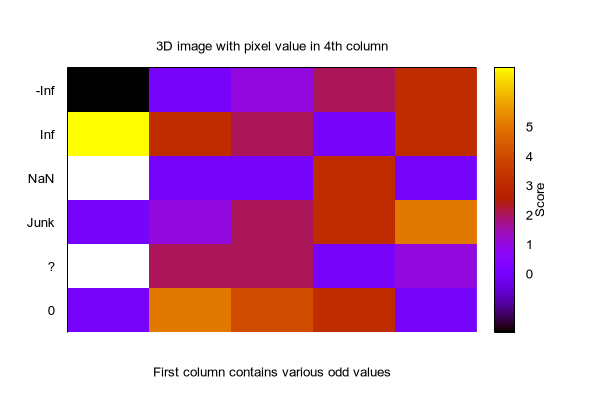


set title "3D image with pixel value in 4th column"

splot $matrixdata matrix using 1:2:(0):3 with image


Click here for minimal script to generate this plot
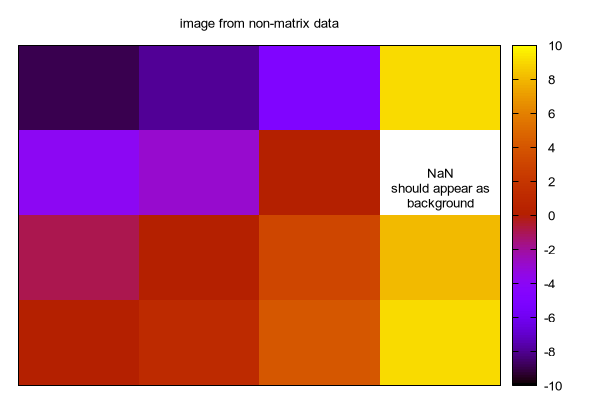


$DATA << EOD
0	0	0
0	1	-1
0	2	-4
0	3	-9

1	0	1
1	1	0
1	2	-3
1	3	-8

2	0	4
2	1	3
2	2	0
2	3	-5

3	0	9
3	1	8
3	2	NaN
3	3	9

EOD

unset xtics
unset ytics
unset key

set title "image from non-matrix data"
set label 1 at 3,2 "NaN\nshould appear as\nbackground" front center
plot $DATA with image 

Click here for minimal script to generate this plot
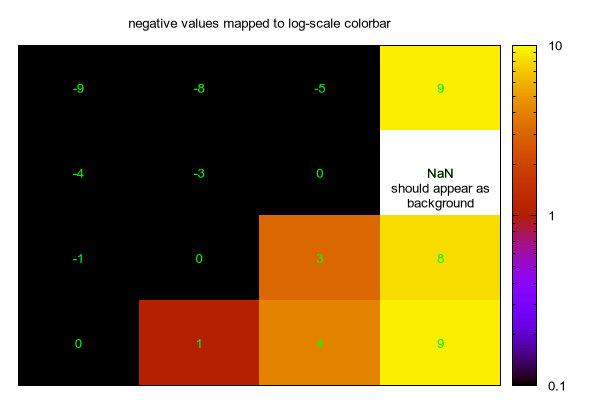


set title "negative values mapped to log-scale colorbar"
set label 2 at 0,2.5 "Negative values become NaN\nwith a log-scale color mapping"
set cbrange [0.1:10]
set log cb
plot $DATA with image, $DATA using 1:2:(sprintf("%g",$3)) with labels tc rgb "green"


Click here for minimal script to generate this plot