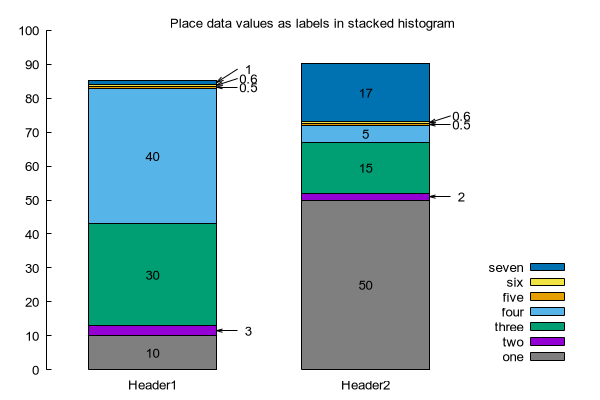
# # From: theozh <theozh@gmail.com> - 2017-10-28 23:01:12 # set title "Place data values as labels in stacked histogram" offset 0,-1 set style data histogram set style histogram columnstacked set style fill solid border lt -1 set boxwidth 0.6 set border 2 set tics nomirror set key bottom set xrange [-0.5:*] $Data <<EOD XXX Header1 Header2 one 10 50 two 3 2 three 30 15 four 40 5 five 0.5 0.5 six 0.6 0.6 seven 1 17 EOD YminSpace = 4 YStep = 2 YExtraDistance = -YStep XShift(n) = (n < YminSpace) ? 0.45 : 0 YShift(n) = (n < YminSpace) ? (YExtraDistance=YExtraDistance+YStep,YExtraDistance) : (YExtraDistance=-YStep,0) plot \ newhistogram lt 9, \ $Data u 2 ti col , '' u 3:key(1) ti col, \ ysum=0 '' skip 1 using (0+XShift($2)):((ysum = ysum + $2, ysum-$2/2+YShift($2))):2 with labels notitle, \ ysum=0 '' skip 1 using (1+XShift($3)):((ysum = ysum + $3, ysum-$3/2+YShift($3))):3 with labels notitle,\ ysum=0 '' skip 1 using ($2>YminSpace ? 1/0:(0+XShift($2)-0.05)):((ysum = ysum + $2, ysum-$2/2+YShift($2))):(-0.1):(-YExtraDistance) ls -1 with vectors not,\ ysum=0 '' skip 1 using ($3>YminSpace ? 1/0:(1+XShift($3)-0.05)):((ysum = ysum + $3, ysum-$3/2+YShift($3))):(-0.1):(-YExtraDistance) ls -1 with vectors not,\Click here for minimal script to generate this plot
