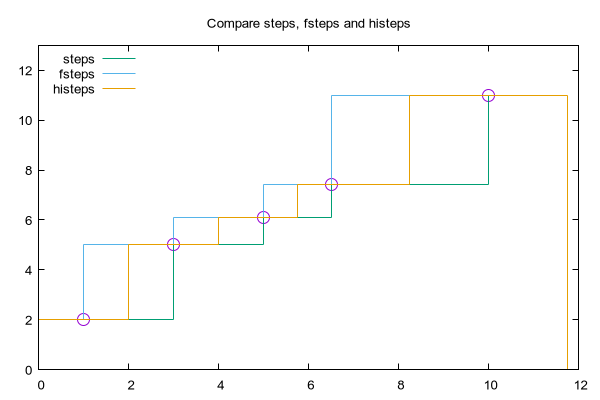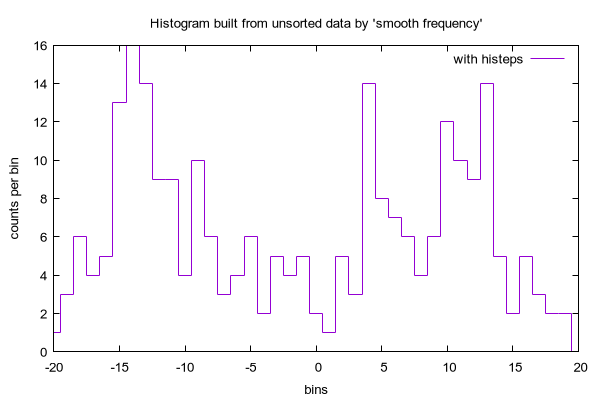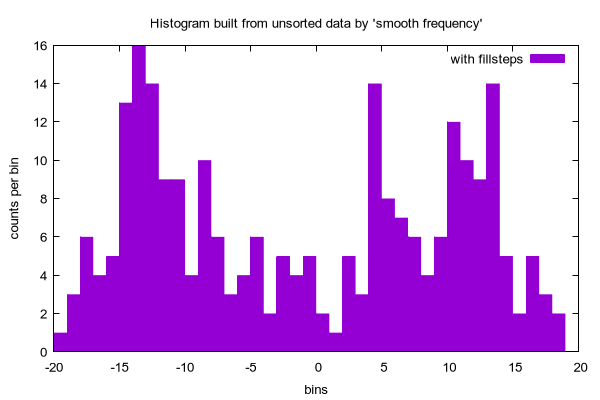
# Illustrate three variants of step plots - same data, three styles # plot with steps # plot with fsteps # plot with histeps # plot with fillsteps set title "Compare steps, fsteps and histeps" set key left plot [0:12][0:13] "steps.dat" notitle with points ps 2 pt 6, \ "steps.dat" title 'steps' with steps, \ 'steps.dat' title 'fsteps' with fsteps, \ 'steps.dat' title 'histeps' with histepsClick here for minimal script to generate this plot


