Back to demo index

gnuplot demo script: voxel.dem

autogenerated by webify.pl on Fri Dec 20 14:48:08 2024
gnuplot version gnuplot 6.0 patchlevel 2
# Demonstrate use of a voxel grid to assign color values to
# components of a surface plot.
#	splot with points
#	splot with pm3d

# test for voxel support in this copy of gnuplot
if (!exists("VoxelDistance")) exit

load "gen-random.inc"

unset key
rlow = -4.0
rhigh = 4.0
set xrange [rlow:rhigh]; set yrange [rlow:rhigh]; set zrange [rlow:rhigh]
set xtics axis nomirror; set ytics axis nomirror; set ztics axis nomirror;
set border 0
set xyplane at 0
set xzeroaxis lt -1; set yzeroaxis lt -1; set zzeroaxis lt -1;
set view 68, 28, 1.6, 0.9
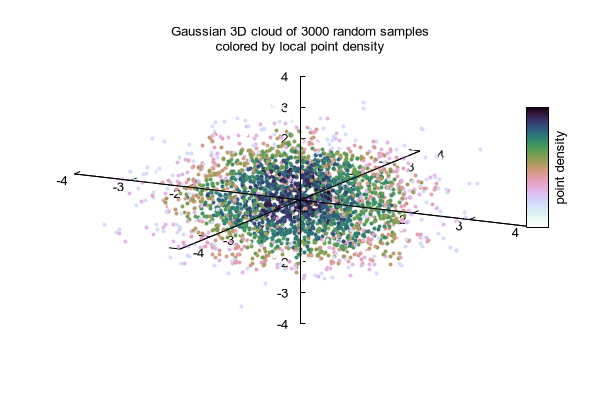
tstring(n) = sprintf("Gaussian 3D cloud of %d random samples\ncolored by local point density", n)
set title tstring(nsamp)

set palette cubehelix negative
set log cb; unset cbtics;
set cblabel "point density"

# define 100 x 100 x 100 voxel grid
set vgrid $vdensity size 100
vclear $vdensity

# fill a spherical region around each point in $random
vfill $random using 1:2:3:(0.33):(1.0)

splot $random using 1:2:3:(voxel($1,$2,$3)) with points pt 7 ps 0.5 lc palette


Click here for minimal script to generate this plot


set title "step through volume using the density values to color a surface\n" \
        . "splot '++' using 1:2:(z):(voxel($1,$2,z)) with pm3d"

set view 48, 114
set sample 50,50; set isosample 50,50
set cbrange [1:40]
set pm3d depthorder noborder interpolate 2,2
set pm3d noclipcb
set style fill transparent solid 0.5
set obj 1 rectangle from screen 0,0,0 to screen 1,1,1 behind fs solid 1.0 fc "white"

#
# The loops should only be done if the session is interactive
#
if (!exists("NO_ANIMATION")) {
  do for [iz = -35 : 0] {
    z = iz / 10.
    splot '++' using 1:2:(z):(voxel($1,$2,z)) with pm3d
    ; pause 0.1
  }
  do for [iz = 35 : 0 : -1] {
    z = iz / 10.
    splot '++' using 1:(-z):2:(voxel($1,-z,$2)) with pm3d, \
          '++' using 1:2:(0):(voxel($1,$2,0)) with pm3d
    ; pause 0.1
  }
} else {
  print "Skipping animation"
}

#
# replot once with all three axis slices
#
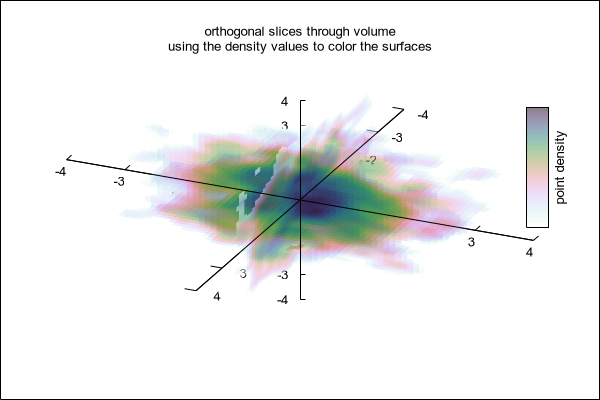
set title "orthogonal slices through volume\n" \
         . "using the density values to color the surfaces"
splot '++' using 1:(0):2:(voxel($1,0,$2)) with pm3d, \
      '++' using 1:2:(0):(voxel($1,$2,0)) with pm3d, \
      '++' using (0):1:2:(voxel(0,$1,$2)) with pm3d


Click here for minimal script to generate this plot


#
# release storage space
#
unset vgrid $vdensity