Back to demo index

gnuplot demo script: concave_hull.dem

autogenerated by webify.pl on Wed Aug 21 21:18:12 2024
gnuplot version gnuplot 6.1 last modified 2024-08-21
#
# Debugging / test code for Delaunay triangulation, χ-shapes,
# and generation of concave hulls.
#
if (!strstrt(GPVAL_COMPILE_OPTIONS, "+CHI_SHAPES")) {
    print "This copy of gnuplot does not support concave hulls"
    exit  # return to caller
}

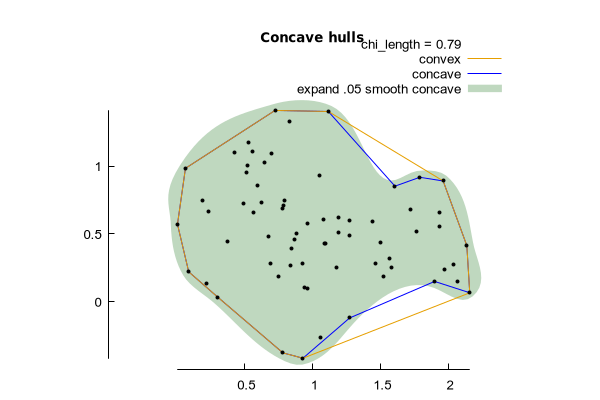
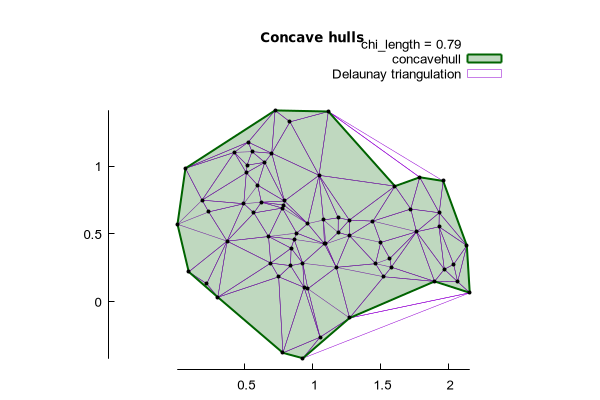
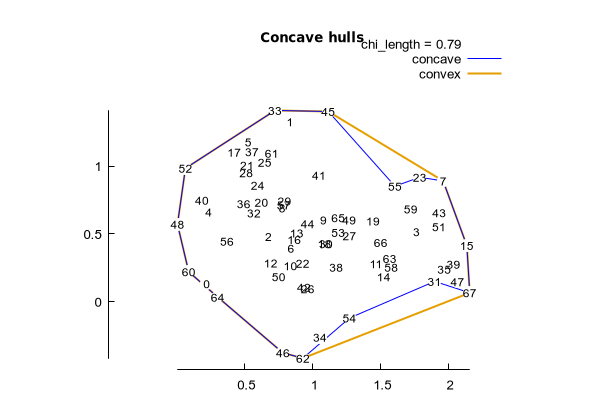
set title "Concave hulls" offset 0,-2 font ":Bold"

if (!exists("N")) { N = 17 }

set sample N*10

set print $DATA
do for [i=1:N] {
    print rand(0), rand(0)
    print rand(0) + 0.3, rand(0) + 0.5
    print rand(0) + 0.6, rand(0) - 0.5
    print rand(0) + 1.2, rand(0)
}
unset print

set xrange [-.5 : 2.5]
set yrange [-.5 : 2.0]
set isotropic
set key invert
set tics 0.5 nomirror rangelimited
set border 3

plot $DATA using 1:2 convexhull with lines lw 2 lt 4 title "convex", \
     $DATA using 1:2 concavehull with lines lc "blue" title "concave", \
     $DATA using 1:2 with points pt 7 ps 2 lc bgnd notitle, \
     $DATA using 1:2:(sprintf("%d",int($0))) with labels font ",9" notitle, \
     keyentry title sprintf("chi_length = %.2f",GPVAL_CHI_LENGTH) noenhanced


Click here for minimal script to generate this plot


set style fill transparent solid 0.25 noborder

plot $DATA using 1:2 concavehull expand .05 smooth path with filledcurve fc "dark-green" \
           title "expand .05 smooth concave", \
     $DATA using 1:2 concavehull with lines lc "blue" title "concave", \
     $DATA using 1:2 convexhull with lines lw 1 lt 4 title "convex", \
     $DATA using 1:2 with points pt 7 ps 0.5 lc "black" notitle, \
     keyentry title sprintf("chi_length = %.2f",GPVAL_CHI_LENGTH) noenhanced


Click here for minimal script to generate this plot


#
# This uses [undocumented?] filter "delaunay" to convert the original set
# of points into a polygon representation of the Delaunay triangulation.
# This will fail if the debugging code is not present or not enabled.
#
if (N < 50) {
    set style fill transparent solid 0.25 border
    plot $DATA using 1:2 delaunay with polygons fs empty lw 0.5 title "Delaunay triangulation", \
        $DATA using 1:2 concavehull with filledcurve fc "dark-green" lw 2 title "concavehull", \
	$DATA using 1:2 with points pt 7 ps 0.5 lc "black" notitle, \
        keyentry title sprintf("chi_length = %.2f",GPVAL_CHI_LENGTH) noenhanced


Click here for minimal script to generate this plot


}