|
if (!strstrt(GPVAL_COMPILE_OPTIONS, "+CEXINT")) {
    print "This copy of gnuplot does not support complex expint"
    set encoding save_encoding
    exit
}

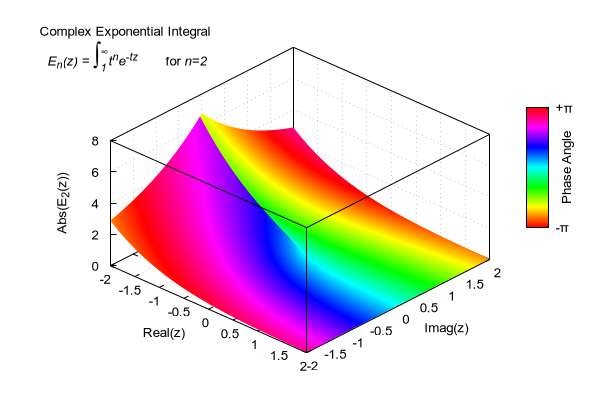
set title "Complex Exponential Integral\n\n {/:Italic {E_n(z) = }{/*2 ∫@_{/*0.5 1}^{/*.5 ∞}}{t^ne^{-tz}}}       for {/:Italic n=2}"
set title offset -25

set border -1
set grid x y z
set grid vertical
unset key
set view 35, 43, 0.84, 1.4
set xyplane 0
set samples 101, 101
set isosamples 101, 101

set xtics offset 0, -0.5
set ytics offset 0, -0.5
set ztics 2
set cbtics   ("-π" -3.14159, "+π" 3.14159)
set urange [ -2.0 : 2.0 ]
set vrange [ -2.0 : 2.0 ]
set xrange [ -2.0 : 2.0 ]
set yrange [ -2.0 : 2.0 ]
set zrange [  0.0 : 8.0 ]
set xlabel "Real(z)"
set ylabel "Imag(z)"
set zlabel "Abs(E_2(z))" rotate
set cblabel "Phase Angle"
set cblabel  offset -1, 0, 0  rotate
set cbrange [ -3.14159 : 3.14159 ]
set pm3d corners2color c1
set palette color model HSV defined ( 0 0 1 1, 1 1 1 1 )
#
splot '++' using 1:2:(abs( expint(2,x+y*I))):(arg( expint(2,x+y*I))) with pm3d


Click here for minimal script to generate this plot
|


