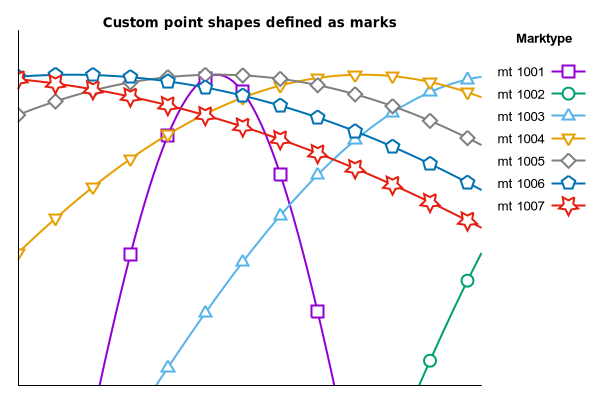
# Use new gnuplot feature "marks" to construct point types
# that supplement the ones otherwise available.
# Instead of using plot style "with linespoints pointtype N"
# we substitute "with linesmarks marktype N".
#
# These are background-fill polygons
# 1001	- square
# 1002	- circle
# 1003	- triangle
# 1004	- inverted triangle
# 1005	- diamond
# 1006	- pentagon
# 1007	- star

if (!strstrt(GPVAL_COMPILE_OPTIONS,"+MARKS")) {
    print ">>> Skipping demo <<<\n"
    print "This copy of gnuplot was built without support for marks"
    exit
}

FILL = 2
STROKE = 1
FILLSTROKE = 3
BACKGROUND = 4

array Square = [{-0.5,-0.5}, { 0.5,-0.5}, { 0.5, 0.5}, {-0.5, 0.5}, {-0.5,-0.5}]
array Triangle = [{0,0.6}, {0.5196,-0.3},{-0.5196,-0.3},{0,0.6}]
array Star = [ {0.707,0.971},{0.0,0.611},{-0.707,0.971},{-0.571,0.185},{-1.141,-0.371}, \
	       {-0.353,-0.485},{0.0,-1.2},{0.353,-0.485},{1.141,-0.371},{0.571,0.185}, \
	       {0.707,0.971}]

set angle degrees
set mark 1001 Square using 2:3:(FILLSTROKE)            fc bgnd \
              title "square"
set mark 1003 Triangle using 2:3:(FILLSTROKE)          fc bgnd \
              title "triangle"
set mark 1004 Triangle using 2:(-$3):(FILLSTROKE)      fc bgnd \
              title "down triangle"
set mark 1007 Star using (0.7*$2):(0.7*$3):(FILLSTROKE) fc bgnd \
              title "star"
set mark 1002 [0:360:10] '+' using (0.5*sin($1)):(0.5*cos($1)):(FILLSTROKE) fc bgnd \
              title "circle"
set mark 1005 [0:360:90] '+' using (0.6*sin($1)):(0.6*cos($1)):(FILLSTROKE) fc bgnd \
              title "diamond"
set mark 1006 [0:360:72] '+' using (0.6*sin($1)):(0.6*cos($1)):(FILLSTROKE) fc bgnd \
              title "pentagon"
unset angle

set linetype 1001 lc 1
set linetype 1002 lc 2
set linetype 1003 lc 3
set linetype 1004 lc 4
set linetype 1005 lc "grey50"
set linetype 1006 lc 6
set linetype 1007 lc 7

set xrange [-10:-5]
set yrange [.3 : 1.1]
set border 3 front
unset tics
set key outside spacing 1.5
set key title "{/:Bold Marktype}\n"

set title "Custom point shapes defined as marks" font "/:Bold" offset 0,-1
plot for [i=1:7] lt=1000+i, -sin(x/i) with linesmarks mt (lt) \
                  lt lt lw 2 pi 8 ps 2.0 title sprintf("mt %d",lt)


Click here for minimal script to generate this plot
