#
# Illustrate definition of marks using formulas
#
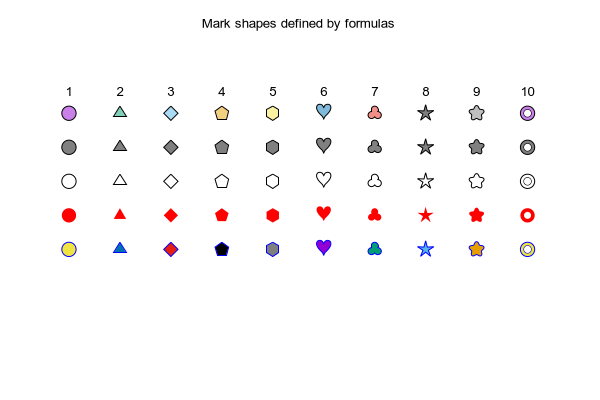
set title "Mark shapes defined by formulas"
set angle degrees
set mark 1 [t=0:360:10] "+" using (sin(t)):(cos(t)) ### circle
set mark 2 [t=0:360:120] "+" using (sin(t)):(cos(t)) ### triangle
set mark 3 [t=0:360:90] "+" using (sin(t)):(cos(t)) ### diamond
set mark 4 [t=0:360:72] "+" using (sin(t)):(cos(t)) ### pentagon
set mark 5 [t=0:360:60] "+" using (sin(t)):(cos(t)) ### hexagon
set mark 6 [t=0:360:10] "+" using (cos(t)):(0.8*(sqrt(abs(cos(t)))+sin(t))) ### heart
set mark 7 [t=0:360:10] "+" using (r=0.5*abs(cos(3/2.0*t))+0.5, r*sin(t)):(r*cos(t)) ### 3 petals
set mark 8 [t=0:360:72/2] "+" using (r=0.4*(cos(5*t)+2), r*sin(t)):(r*cos(t)) ### star
set mark 9 [t=0:360:72/2/10] "+" using (r=0.18*(cos(5*t)+5), r*sin(t)):(r*cos(t)) ### 5 petals
# bullseye
set mark 10 [t=0:360:10] "+" using (sin(t)):(cos(t))
set mark 10 append [t=0:360:10] "+" using (0.51*sin(t)):(0.51*cos(t)):(1)
set mark 10 append [t=0:360:10] "+" using (0.49*sin(t)):(0.49*cos(t)):(4)
set angle
set xrange [0 : 11]
set yrange [0.2 : 1.2]
unset border
unset tics
unset key
array dummy[1]
S = 1.2
plot \
for [k=1:10] dummy using (k):(1) with marks mt k ps S fill solid 0.5 border lc 'black', \
for [k=1:10] dummy using (k):(0.9) with marks mt k ps S fill solid 0.5 border fc 'black', \
for [k=1:10] dummy using (k):(0.8) with marks mt k ps S fill solid 0.0 border lc 'black', \
for [k=1:10] dummy using (k):(0.7) with marks mt k ps S fill solid 1.0 noborder fc 'red', \
for [k=1:10] dummy using (k):(0.6) with marks mt k ps S fill solid 1.0 border lc 'blue', \
for [k=1:10] dummy using (k):(1):(sprintf("%i",k)) with labels center offset 0,1.5
Click here for minimal script to generate this plot
