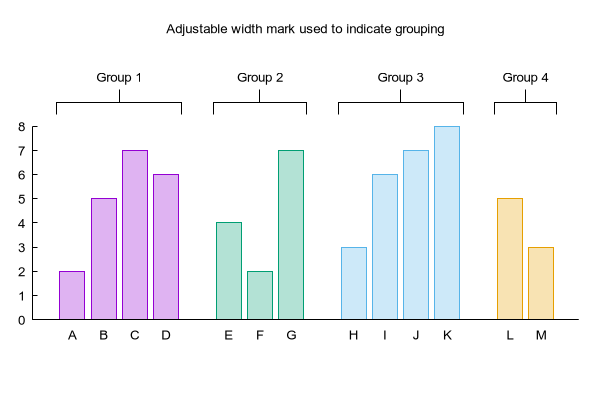
# Define an adjustable-width mark that indicates grouping
# Hiroki Motoyoshi 2024

set title "Adjustable width mark used to indicate grouping"
set title offset 0,2

$bar_data_in <<EOD
# Name Value
A 2
B 5
C 7
D 6

E 4
F 2
G 7

H 3
I 6
J 7
K 8

L 5
M 3
EOD

stats $bar_data_in using 2 nooutput

n = STATS_blank + 1
array member[n]
do for [i=1:n] {
  member[i] = 0
}

set table $bar_data
  plot $bar_data_in using (strcol(1)):2:(idx = column(-1)+1, member[idx]=member[idx]+1,idx) with table
unset table

set print $group_data
offset = 1
do for [i=1:4] {
  print sprintf('"Group %i" %i %i', i, member[i], offset)
  offset = offset + member[i] + 1
}
unset print

set tmargin sc 0.8
set bmargin sc 0.2

set autoscale xfix
set yrange [0:*]
set offsets gr 0.05, gr 0.05, gr 0.1
unset key

set xtics nomirror
set ytics 0,1,8 nomirror

# "set border 3" would extend the y axis verticallay to include the marks.
# Setting explicit yrange [0:8] would put the marks out of range.
# So we replace the left-hand border with an arrow from y=0 to y=8
set border 1
set arrow from graph 0, first 0 to graph 0, first 8 nohead

# Description of a single mark consisting of a half-height horizontal square bracket
# with a centered vertical bar above it:
#
#                  |
#       |⎺⎺⎺⎺⎺⎺⎺⎺⎺⎺⎺⎺⎺⎺⎺⎺⎺⎺⎺⎺⎺⎺|
#
# When plotted, the using specfier will provide x, y, width, height

$group_mark <<EOD
# x  y   1=stroke
  0 -0.5  1
  0  0    1
  1  0    1
  1 -0.5  1

0.5  0.0  1
0.5  0.5  1
EOD

set mark 1 $group_mark

plot $bar_data using ($0+$3):2:(0.8):3:xtic(1) \
                 with boxes lc variable fill solid 0.3, \
     $group_data using ($3-0.5):(9):2:(1) \
                 with marks mt 1 units xy lt -1 lw 1, \
     $group_data using ($3-0.5+$2/2):(9):1 \
                 with labels center offset 0,1.7


Click here for minimal script to generate this plot
