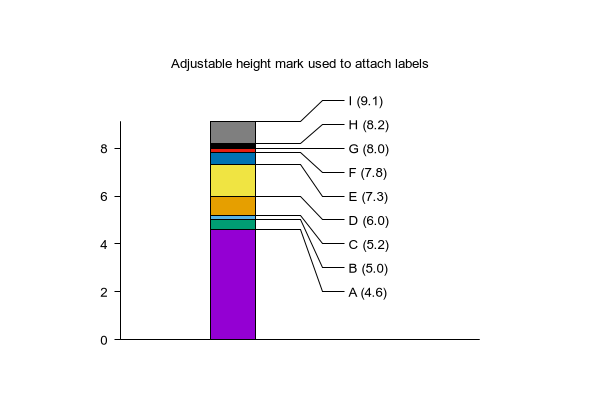
# Define an adjustible mark to spread out closely spaced labels
# The mark looks like this, with the height controlled by the
# yscale value given in the 4th column of the "plot with marks" command
# ___
#    \____ label
#

set title "Adjustable height mark used to attach labels"
set title offset 0,1

$pointer <<EOD
0.0  0 1
1.0  0 1
1.5 -1 1
2.0 -1 1
EOD

set mark 1 $pointer

# Only one column of data is really necessary since the 3rd column
# is just the incremental difference in 2nd column values.
# Precalculating the deltas simplifies the y coordinate calculations
# in the sample plot below.

$data <<EOD
A 4.6  4.6
B 5    0.4
C 5.2  0.2
D 6    0.8
E 7.3  1.3
F 7.8  0.5
G 8    0.2
H 8.2  0.2
I 9.1  0.9
EOD

set bmargin at screen 0.15
set tmargin at screen 0.75
set lmargin at screen 0.2
set rmargin at screen 0.8
set border 3
set xrange [-3:5]
unset xtics
set link y2
set yrange [0:*]
set ytics nomirror out rangelimited
unset key

# Specify evenly spaced labels
label_bot = 2.0
label_inc = 1.0
label_ypos(i)  = label_bot + i*label_inc
mark_yscale(i) = $2 - label_ypos(i)

set style histogram columns
set style fill solid border lc "black"

plot newhistogram at -0.5, $data using 3 with histogram, \
     $data using (0.0):2:(1):(mark_yscale($0)) axes x1y2 \
                    with marks units xy lt black, \
     $data using (2.0):(label_ypos($0)):(sprintf("%s (%.1f)",strcol(1), $2)) axes x1y2 \
                    with labels offset 0.5 left font ",10"


Click here for minimal script to generate this plot
