Back to demo index

gnuplot demo script: pm3d.dem

autogenerated by webify.pl on Wed Aug 21 21:28:29 2024
gnuplot version gnuplot 6.1 last modified 2024-08-21
# demo for pm3d splotting
#
# This demo can be directly used if your default terminal supports pm3d, 
# like OS/2 Presentation Manager, X11, Linux VGA, Windows.
# Otherwise you can use the output to postscript, for example:
#	set term push; set term postscript color enhanced
#	set out 'pm3d_demo.ps'
#	load 'pm3d.dem'
#	set out; set term pop

# Prepared by Petr Mikulik
# History:
#	- 12. 3. 2003 pm: added demo for corners2color
#	-  9. 3. 2002 pm: added demo for ftriangles
#	- 31. 1. 2002 pm: removed pm3d/demo and stand-alone pm3d.dem in demo/
#	- 29. 1. 2002 joze: added demo for the 4th column
# 	- 18. 3. 2001 pm: updated for cb-axis
# 	- 18.11. 2000 pm: updated for 'set colorbox'
# 	- 03. 3. 2000 joze: updated to show new pm3d features
#	- 15. 6. 1999 pm: update for `set pm3d`+`set palette`
# 	- 29. 4. 1999 pm: the 1st version, directory pm3d/demo

# 2023 (version 6) EAM - added test cases for additional pm3d options

set xlabel "x"
set ylabel "y"
set key top
set border 4095
set xrange [-15:15]
set yrange [-15:15]
set zrange [-0.25:1]
set samples 25
set isosamples 20

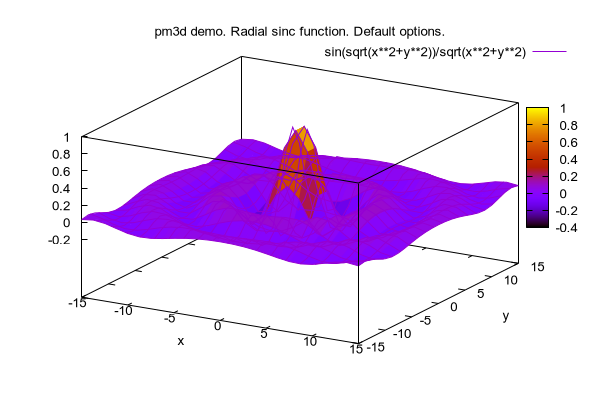
set title "pm3d demo. Radial sinc function. Default options."
set pm3d; set palette
#show pm3d
#show palette
splot sin(sqrt(x**2+y**2))/sqrt(x**2+y**2)

Click here for minimal script to generate this plot
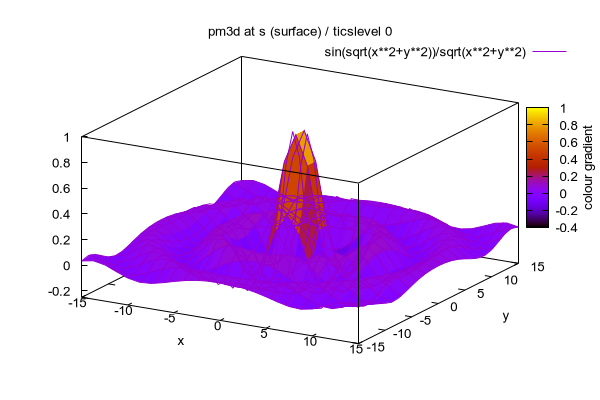


set title "pm3d at s (surface) / ticslevel 0"
set ticslevel 0
set pm3d at s
set cblabel "colour gradient"
replot

Click here for minimal script to generate this plot
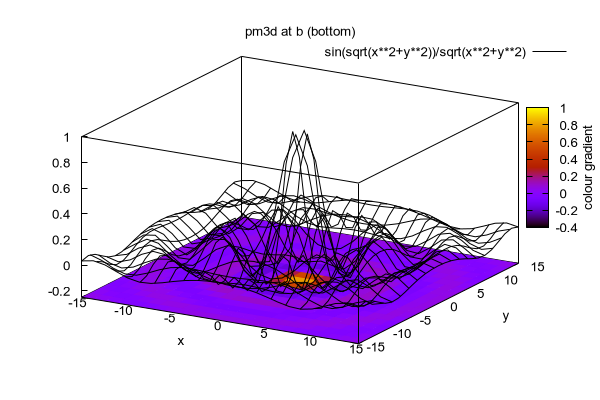


set title "pm3d at b (bottom)"
set pm3d at b
splot sin(sqrt(x**2+y**2))/sqrt(x**2+y**2) lc "black"

Click here for minimal script to generate this plot
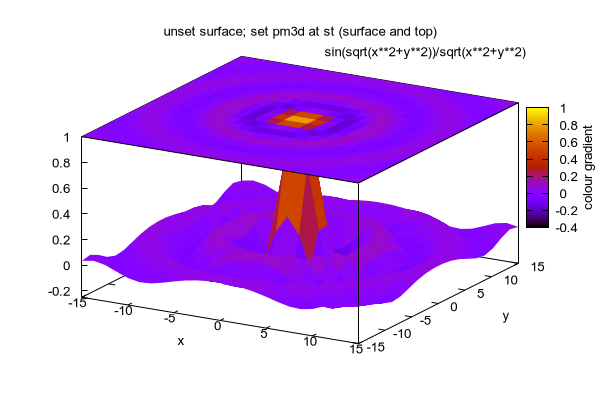


set title "unset surface; set pm3d at st (surface and top)"
unset surface
set pm3d at st
replot

Click here for minimal script to generate this plot
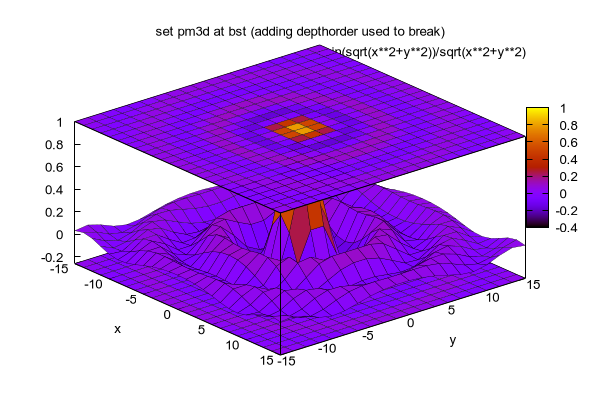


unset cblabel

set title "set pm3d at bst (adding depthorder used to break)"
set view 50,50
set pm3d at bst border lt -1 lw .3
set pm3d depthorder
set xyplane at -0.26
replot

Click here for minimal script to generate this plot
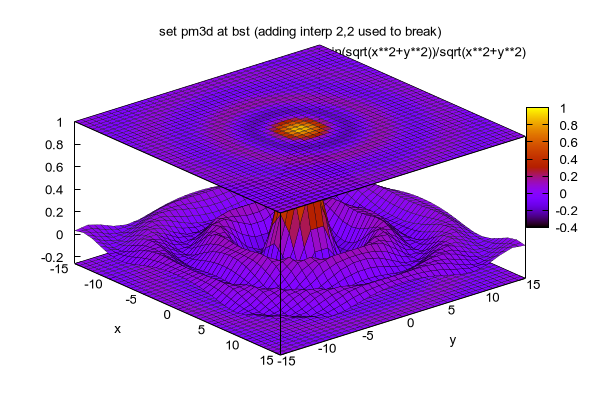


set title "set pm3d at bst (adding interp 2,2 used to break)"
set pm3d interp 2,2
replot

Click here for minimal script to generate this plot
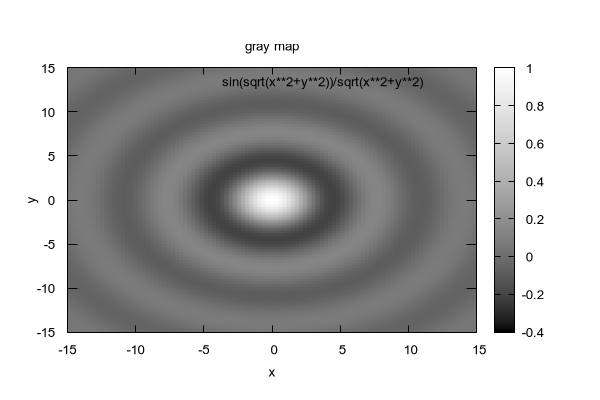


# reset pm3d to default settings
set title "gray map"
set view map
set pm3d
set palette gray
set samples 100; set isosamples 100
splot sin(sqrt(x**2+y**2))/sqrt(x**2+y**2)

Click here for minimal script to generate this plot
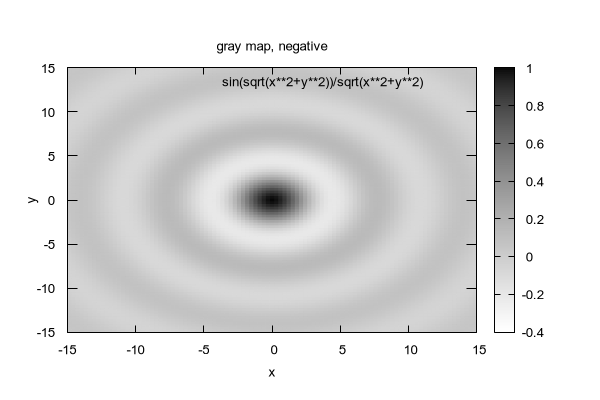


set title "gray map, negative"
set palette gray negative
replot

Click here for minimal script to generate this plot
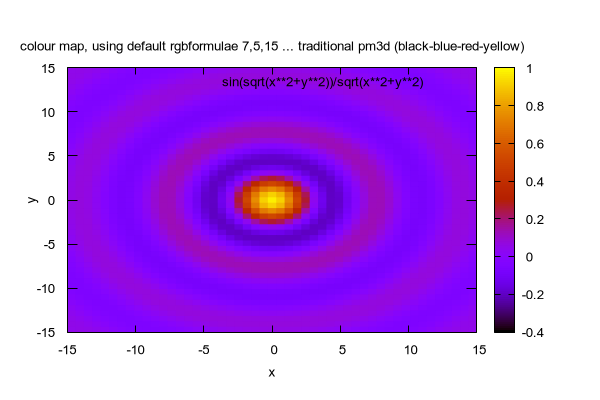


set title "colour map, using default rgbformulae 7,5,15 ... traditional pm3d (black-blue-red-yellow)"
set palette color positive
set samples 50; set isosamples 50
replot

Click here for minimal script to generate this plot
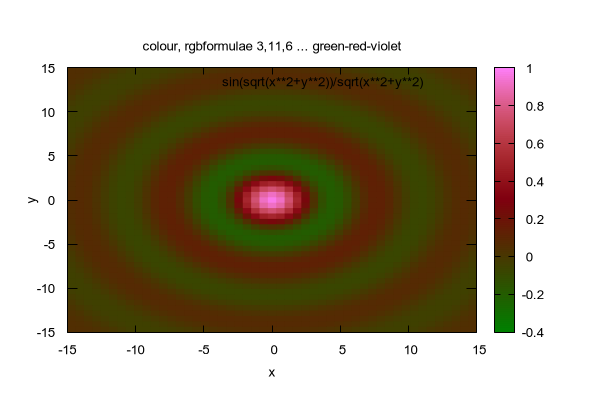


set title "colour, rgbformulae 3,11,6 ... green-red-violet"
set palette rgbformulae 3,11,6
replot

Click here for minimal script to generate this plot
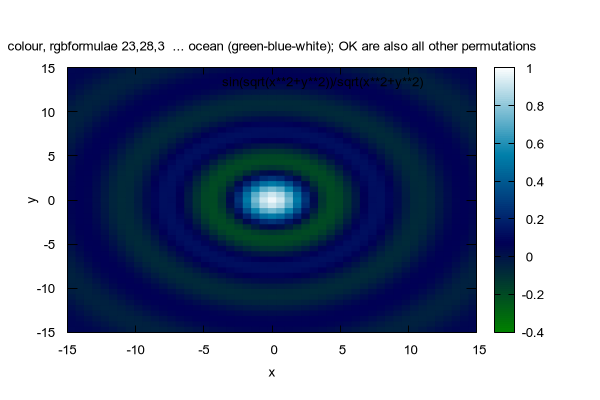


set title "colour, rgbformulae 23,28,3  ... ocean (green-blue-white); OK are also all other permutations"
set palette rgbformulae 23,28,3
replot

Click here for minimal script to generate this plot
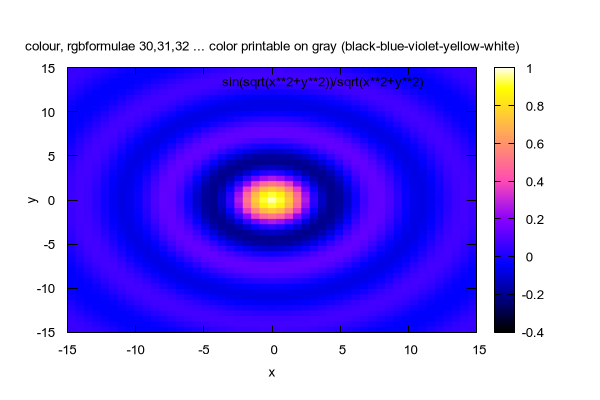


set title "colour, rgbformulae 30,31,32 ... color printable on gray (black-blue-violet-yellow-white)"
set palette rgbformulae 30,31,32
replot

Click here for minimal script to generate this plot
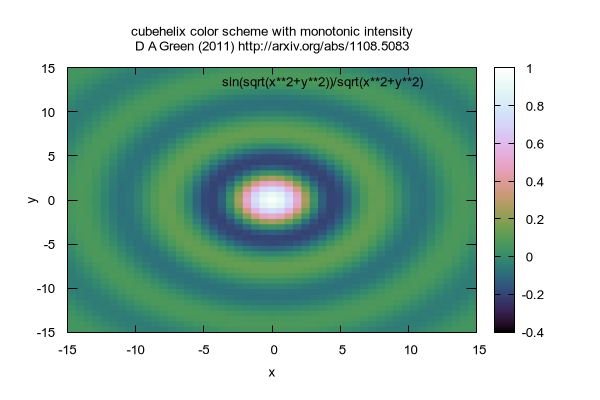


set title "cubehelix color scheme with monotonic intensity\nD A Green (2011) http://arxiv.org/abs/1108.5083" offset 0,1
set palette cubehelix
replot

Click here for minimal script to generate this plot
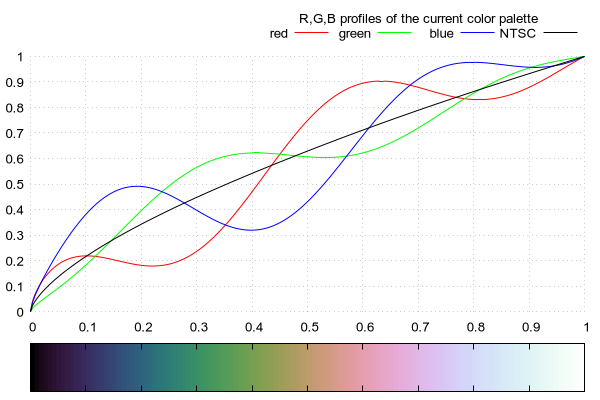


test palette

Click here for minimal script to generate this plot
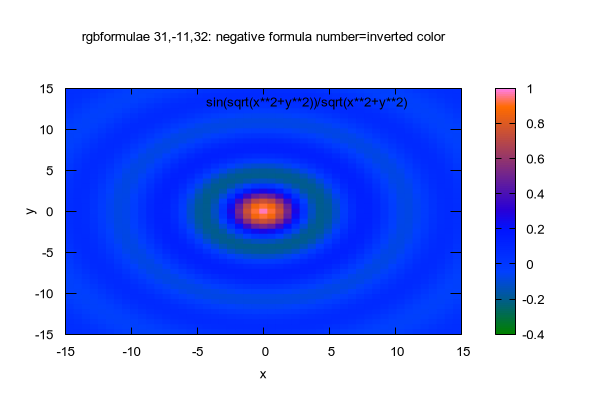


set title "rgbformulae 31,-11,32: negative formula number=inverted color"
set palette rgbformulae 31,-11,32
replot

Click here for minimal script to generate this plot
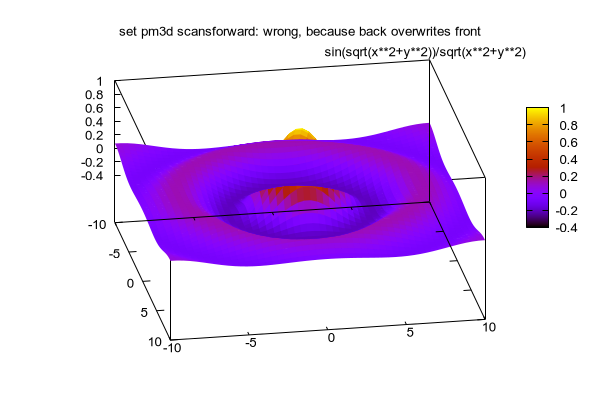


set yrange [*:*] noreverse


set title "set pm3d scansforward: wrong, because back overwrites front"
set pm3d
set palette
set view 130,10
set samples 50; set isosamples 50
set border 4095
unset surface
set pm3d at s scansforward
splot sin(sqrt(x**2+y**2))/sqrt(x**2+y**2)

Click here for minimal script to generate this plot
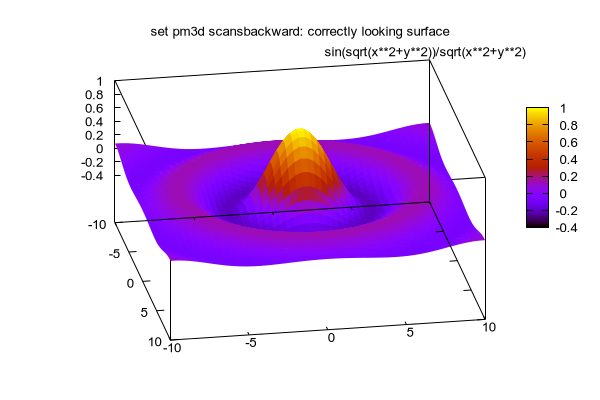


set title "set pm3d scansbackward: correctly looking surface"
set xlabel
set border 4095
set pm3d scansbackward
replot

Click here for minimal script to generate this plot
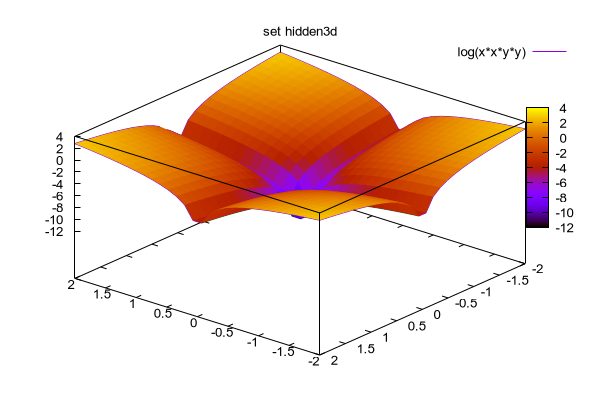


set title "set hidden3d"
set samples 30; set isosamples 30
set hidden3d
set pm3d
set surface
set view 50,220
set xrange [-2:2]
set yrange [-2:2]
splot log(x*x*y*y)

Click here for minimal script to generate this plot
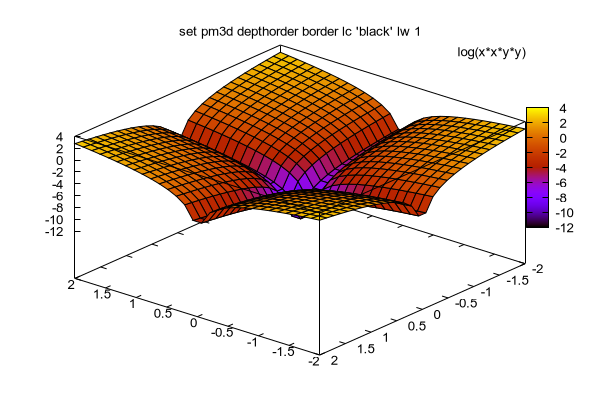


unset hidden3d

# draw the surface using pm3d's depth sorting with line type 100
unset hidden
unset surface

set title "set pm3d depthorder border lc 'black' lw 1"
set samples 30; set isosamples 30
set pm3d
set style line 100 lt 5 lw 0.5
set pm3d depthorder border lc 'black' lw 1
set view 50,220
set xrange [-2:2]
set yrange [-2:2]
splot log(x*x*y*y)

Click here for minimal script to generate this plot
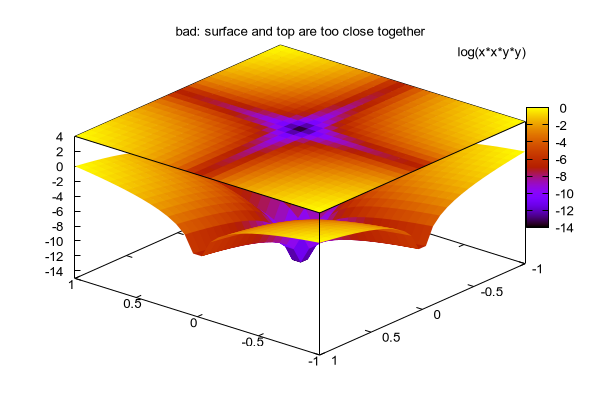


set pm3d

set title "bad: surface and top are too close together"
set xrange [-1:1]
set yrange [-1:1]
unset hidd
set zrange [-15:4]
set ticslevel 0
set pm3d at st
splot log(x*x*y*y)

Click here for minimal script to generate this plot
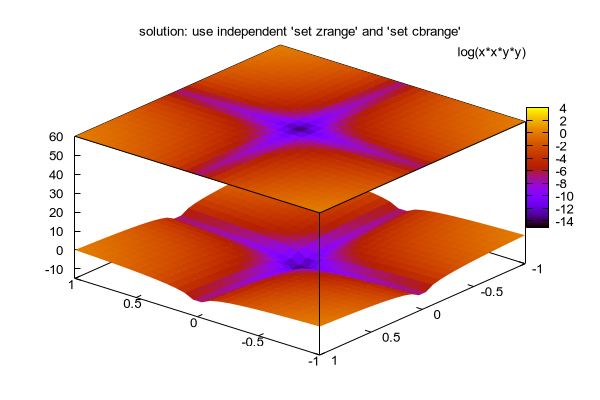


set title "solution: use independent 'set zrange' and 'set cbrange'"
unset surf
set cbrange [-15:4]
set zrange [-15:60]
splot log(x*x*y*y)

Click here for minimal script to generate this plot
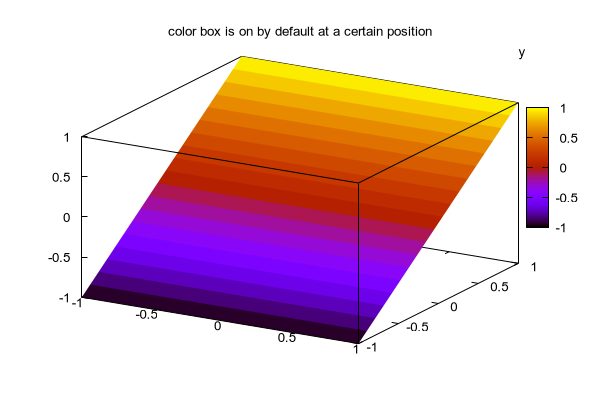


set autoscale cb

set title "color box is on by default at a certain position"
set samples 20; set isosamples 20
set autoscale
set key on
set pm3d
set pm3d at s
set view 60,30
splot y

Click here for minimal script to generate this plot
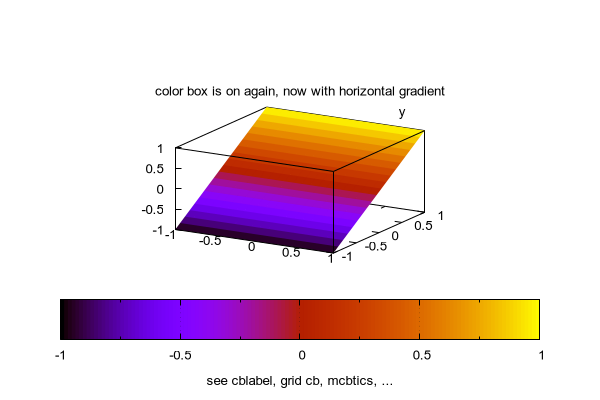


set title "color box is on again, now with horizontal gradient"
set size 0.6,0.6; set origin 0.2,0.25
set colorbox horizontal
set colorbox user origin 0.1,0.15 size 0.8,0.1
set mcbtics 2
set grid cb
set cblabel "see cblabel, grid cb, mcbtics, ..."
replot 

Click here for minimal script to generate this plot
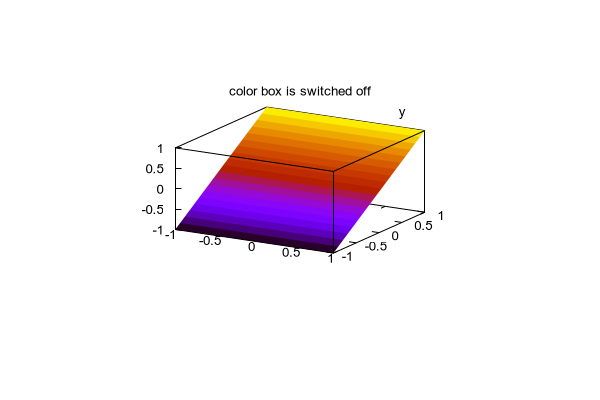


unset cblabel; unset mcbtics; set grid nocb; set colorbox default

set title "color box is switched off"
unset colorbox
replot 

Click here for minimal script to generate this plot
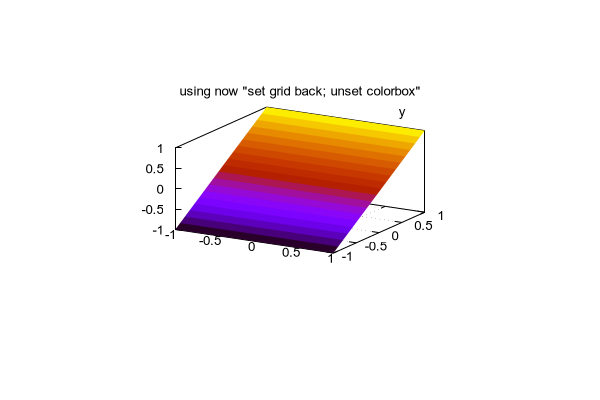


set title 'using now "set grid back; unset colorbox"'
unset colorbox
set pm3d
set border 895
set grid back
replot 

Click here for minimal script to generate this plot
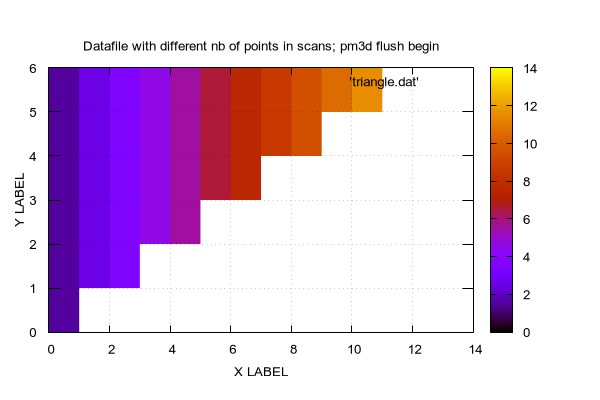


set size 1,1; set origin 0,0
set grid layerdefault
set xlabel "X LABEL"
set ylabel "Y LABEL"

set sample 11; set isosamples 11
set view map
set palette
set colorbox
set lmargin 0


set pm3d flush begin
set title "Datafile with different nb of points in scans; pm3d flush begin"
set pm3d flush begin noftriangles scansforward
splot 'triangle.dat'


Click here for minimal script to generate this plot
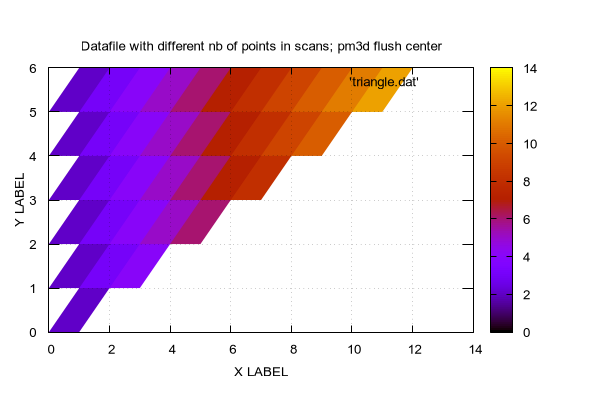


set title "Datafile with different nb of points in scans; pm3d flush center"
set pm3d flush center scansforward
replot

Click here for minimal script to generate this plot
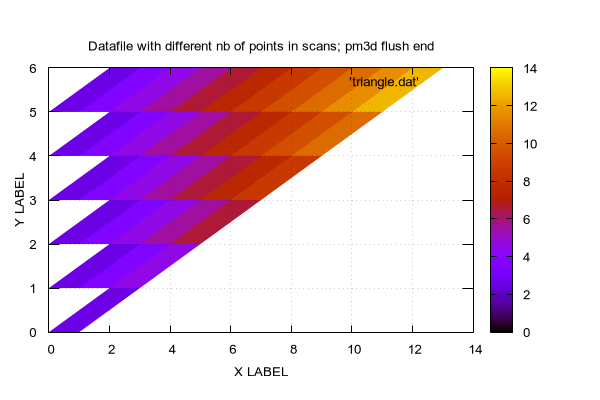


set title "Datafile with different nb of points in scans; pm3d flush end"
set pm3d flush end scansforward
replot

Click here for minimal script to generate this plot
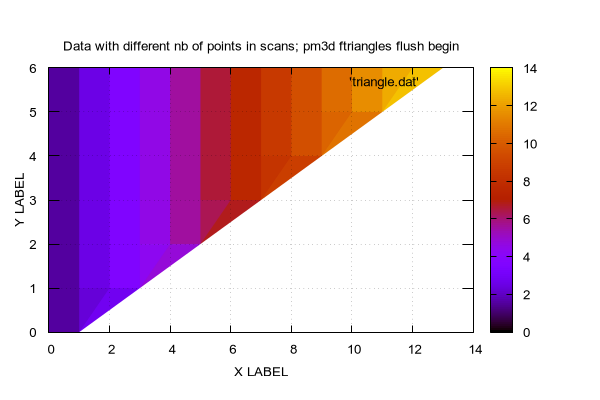


set grid front

set pm3d flush begin
set title "Data with different nb of points in scans; pm3d ftriangles flush begin"
set pm3d flush begin ftriangles scansforward
splot 'triangle.dat'
#show pm3d

Click here for minimal script to generate this plot
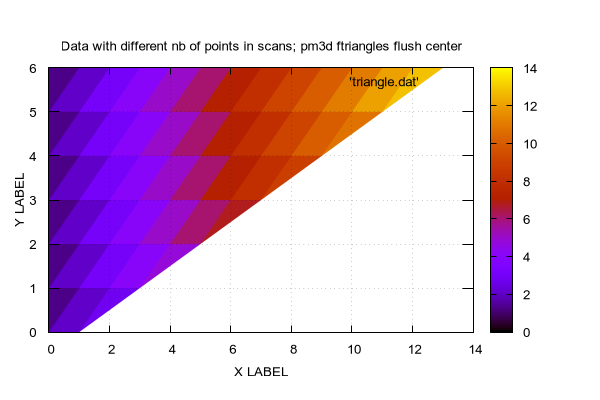


set title "Data with different nb of points in scans; pm3d ftriangles flush center"
set pm3d flush center ftriangles scansforward
replot

Click here for minimal script to generate this plot
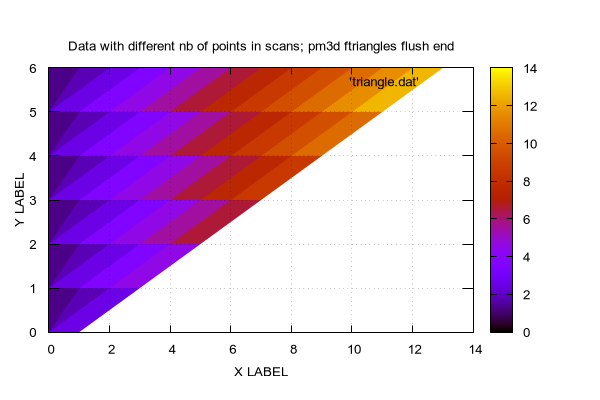


set title "Data with different nb of points in scans; pm3d ftriangles flush end"
set pm3d flush end ftriangles scansforward
replot

Click here for minimal script to generate this plot
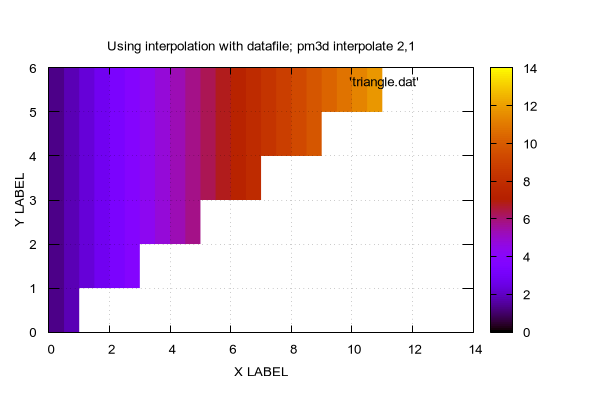


set title "Using interpolation with datafile; pm3d interpolate 2,1"
set pm3d flush begin noftriangles scansforward interpolate 2,1
replot

Click here for minimal script to generate this plot
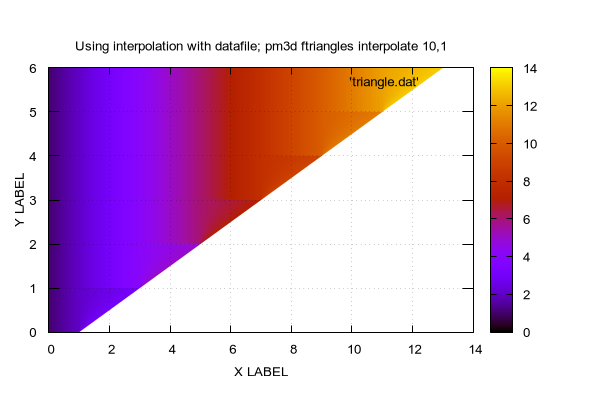


set title "Using interpolation with datafile; pm3d ftriangles interpolate 10,1"
set pm3d flush begin ftriangles scansforward interpolate 10,1
replot

Click here for minimal script to generate this plot
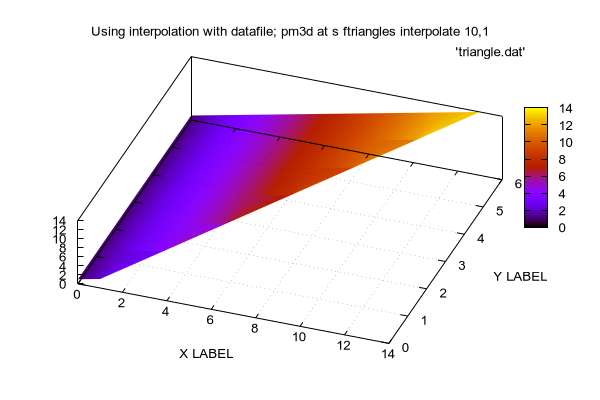


set title "Using interpolation with datafile; pm3d at s ftriangles interpolate 10,1"
set pm3d flush begin ftriangles scansforward at s interpolate 10,1
set view 20,20
replot

Click here for minimal script to generate this plot
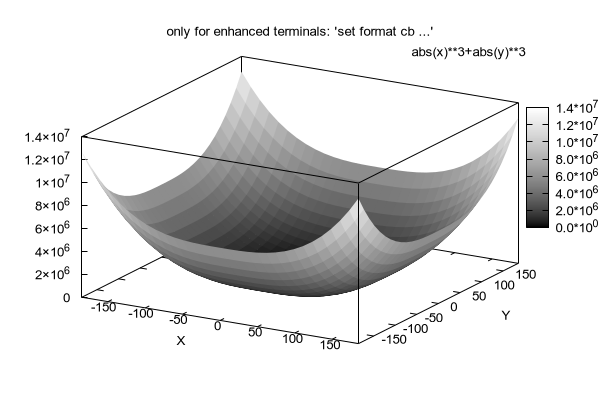


set title "only for enhanced terminals: 'set format cb ...'"
set xlabel "X"
set ylabel "Y"
set sample 31; set isosamples 31
set xrange [-185:185]
set yrange [-185:185]
set format cb "%.01t*10^{%T}"
unset surface
set border 4095
set ticslevel 0
set pm3d at s; set palette gray
set cblabel "the colour gradient"
splot abs(x)**3+abs(y)**3

Click here for minimal script to generate this plot
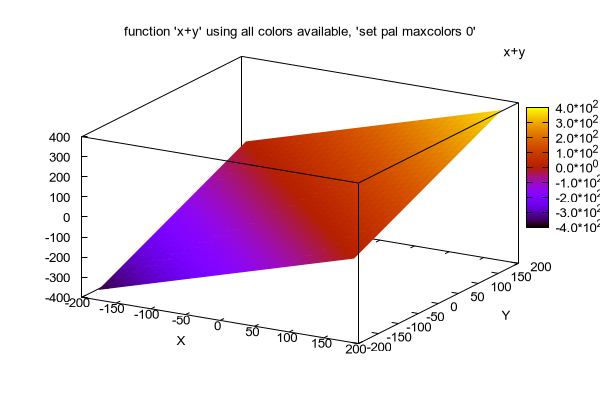


unset cblabel

set pal color
set xrange [*:*]; set yrange [*:*]
set title "function 'x+y' using all colors available, 'set pal maxcolors 0'"
set pal maxcolors 0
splot x+y
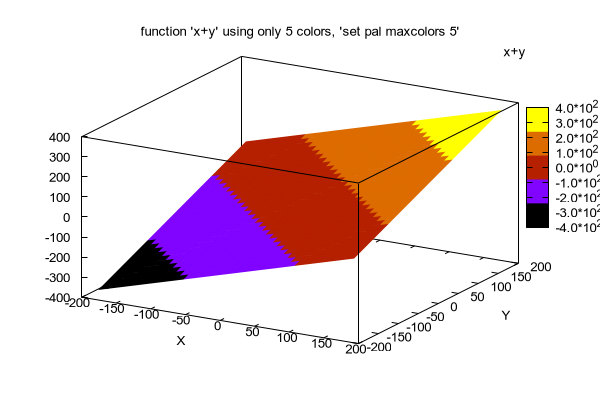
Click here for minimal script to generate this plot


set xrange [*:*]; set yrange [*:*]
set title "function 'x+y' using only 5 colors, 'set pal maxcolors 5'"
set pal maxcolors 5
splot x+y
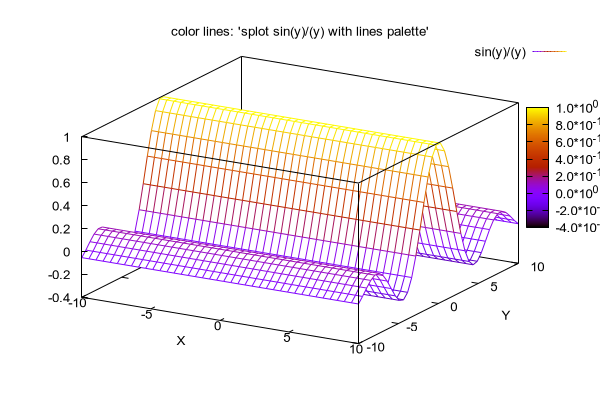
Click here for minimal script to generate this plot


set pal maxcolors 0
unset pm3d
set surface
set format z
set palette
set title "color lines: 'splot sin(y)/(y) with lines palette'"
set ticslevel 0
set border 4095
set xrange [-10:10]; set yrange [-10:10]
set hidden3d
set isosamples 40,40; set samples 40,40
splot sin(y)/(y) w lines palette

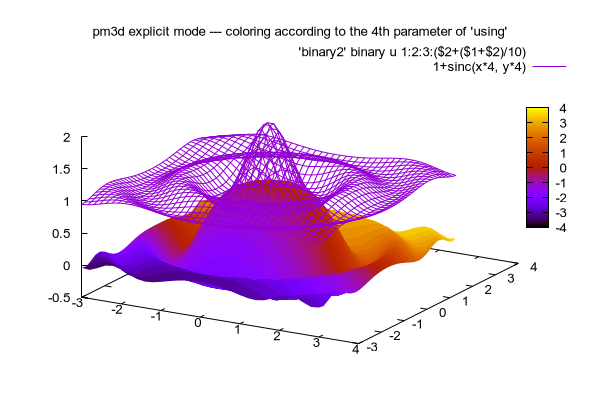
Click here for minimal script to generate this plot


sinc(u,v) = sin(sqrt(u**2+v**2)) /sqrt(u**2+v**2)

set sam 40
set iso 40

set title "pm3d explicit mode --- coloring according to the 4th parameter of 'using'"
set ticslevel 0

set pm3d at s explicit

#	'binary2' binary u 1:2:(column(3)+column(-1)/20.0):3 w pm3d, 

splot \
	'binary2' binary u 1:2:3:($2+($1+$2)/10) w pm3d, \
	1+sinc(x*4, y*4) w l

Click here for minimal script to generate this plot


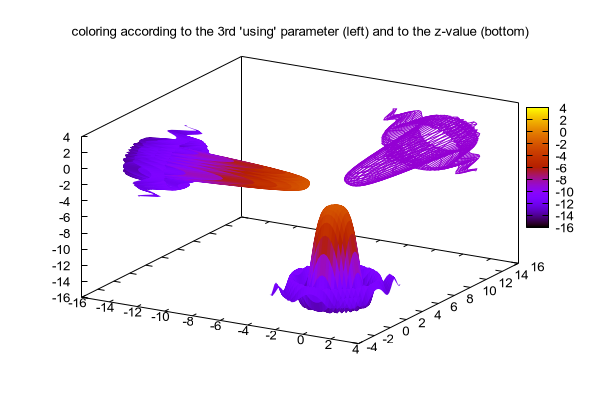
set title "coloring according to the 3rd 'using' parameter (left) and to the z-value (bottom)"
set border 895
splot \
    'binary2' binary u 2:(12 - column(3) * 10):1 notitle w lines, \
    'binary2' binary u (-12 + column(3) * 10):2:1:(-12 + column(3) * 10) notitle w pm3d, \
    'binary2' binary u 1:2:(column(3) * 10 - 12) notitle w pm3d


Click here for minimal script to generate this plot


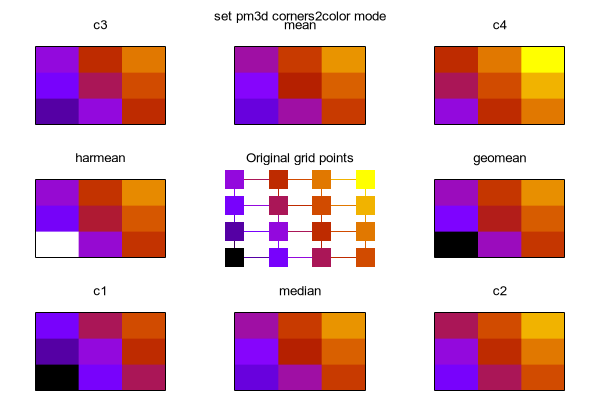
print "Plot by pm3d algorithm draws quadrangles filled with color calculated from"
print "the z- or color-value of the surrounding 4 corners. The following demo shows"
print "different color spots for a plot with very small number of quadrangles (here"
print "rectangular pixels). Note that the default option is 'mean'."

set pm3d at b
set view map
set style func pm3d
set iso 4
set samples 4
set xrange [0:3]
set yrange [0:3]
set cbrange [0:9]
f(x,y)=2*x+y
set key off
unset xtics
unset ytics
unset colorbox
set bmargin 0

# Note: no more space in the following multiplot to show demo for
#set pm3d corners2color median
#set pm3d corners2color geomean

set multiplot title "set pm3d corners2color mode"
# Let us do multiplot grid 3x3:
dx = 1.0/3; dy = 1.0/3;
set size dx,dy

set origin 0*dx,0*dy
set title "c1"
set pm3d corners2color c1
splot f(x,y)

set origin 2*dx,0*dy
set title "c2"
set pm3d corners2color c2
replot

set origin 0*dx,2*dy
set title "c3"
set pm3d corners2color c3
replot

set origin 2*dx,2*dy
set title "c4"
set pm3d corners2color c4
replot

set origin 1*dx,2*dy
set title "mean"
set pm3d corners2color mean
replot

set origin 2*dx,1*dy
set title "geomean"
set pm3d corners2color geomean
replot

set origin 1*dx,0*dy
set title "median"
set pm3d corners2color median
replot

set origin 0*dx,1*dy
set title "harmean"
set pm3d corners2color harmean
replot

set origin 1*dx,1*dy
set title "Original grid points"
unset pm3d
set border 0
unset xtics
unset ytics
unset colorbox
#splot x*2+y with points ps 3 pt 5 palette
splot f(x,y) with linesp ps 3 pt 5 palette

unset multiplot

Click here for minimal script to generate this plot


print "End of pm3d demo."