#
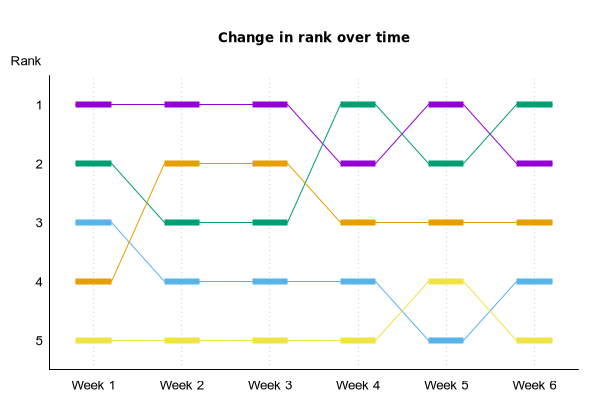
# Ranking by week
#
set title "Change in rank over time"
set title font ":Bold" offset 0,1

$data <<EOD
1 2 3 4 5
1 3 4 2 5
1 3 4 2 5
2 1 4 3 5
1 2 5 3 4
2 1 4 3 5
EOD

set xrange [0.5:6.5]
set yrange [5.5:0.5]
set lmargin 7; set tmargin 5
set border 3
unset key

set tics scale 0 nomirror
set xtics 1,1,6  format "Week %.0g"
set label 1 "Rank  " right at graph 0, 1.05
set ytics 1,1,5
set grid xtics

plot for [k=1:6] $data using ($0+1):(column(k)):(0.4) with hsteps link lw 1 lc k, \
     for [k=1:6] $data using ($0+1):(column(k)):(0.4) with hsteps nolink lw 6 lc k


Click here for minimal script to generate this plot
