#
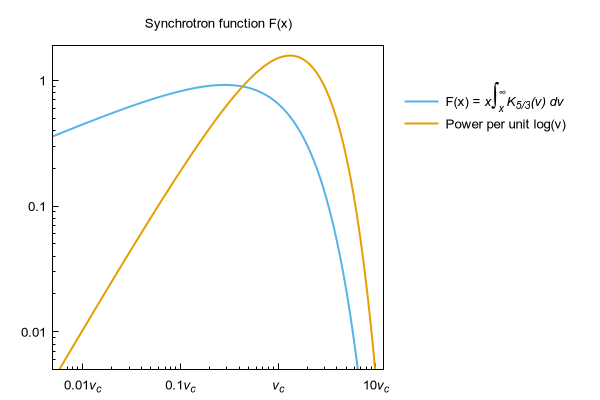
# Synchrotron function F in units of critical frequency v_c
#
save_encoding = GPVAL_ENCODING
set encoding utf8

set title "Synchrotron function F(x)"
set key rmargin reverse Left top title "\n\n" spacing 1.5

set log
set xrange [0.005 : 12.]
set yrange [0.005 : 1.9]

set xtics format "%g{/:Italic v_c}"
set xtics add ("{/:Italic v_c}" 1)
set tics nomirror

F(x) = SynchrotronF(x)
Power(x) = log(10.)*x*F(x)

plot F(x) lt 3 lw 2 title "F(x) = {/:Italic x{/*2 ∫@_{/*0.5 x}^{/*.5 ∞}}K_{5/3}(ν) dν}", \
     Power(x) lt 4 lw 2 title "Power per unit log(ν)"


Click here for minimal script to generate this plot
