Back to demo index

gnuplot demo script: varcolor.dem

autogenerated by webify.pl on Wed Aug 21 21:29:13 2024
gnuplot version gnuplot 6.1 last modified 2024-08-21
#
# Demo/test of variable color in many different plot styles
#
set boxwidth 0.2 abs
set bars front
by3(x) = (((int(x)%3)+1)/6.)
by4(x) = (((int(x)%4)+1)/7.)
rgbfudge(x) = x*51*32768 + (11-x)*51*128 + int(abs(5.5-x)*510/9.)

set yrange [-4:10]
set xrange [0:11]
unset key #below 

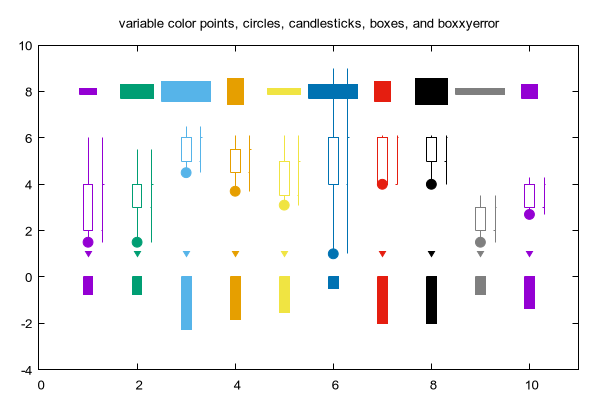
set title "variable color points, circles, candlesticks, boxes, and boxxyerror"
plot 'candlesticks.dat' using 1:(1):1 with points pt 11 lc variable, \
     '' using 1:2:(.1):1 with circles fs solid fc variable, \
     '' using 1:3:2:6:5:1 with candlesticks lc variable, \
     '' using ($1+.3):3:2:6:5:1 with financebars lc variable, \
     '' using 1:(8):(by3($0)):(by4($0)):1 with boxxy fs solid lc variable, \
     '' using 1:(-$2/2):1 with boxes fs solid fc var


Click here for minimal script to generate this plot
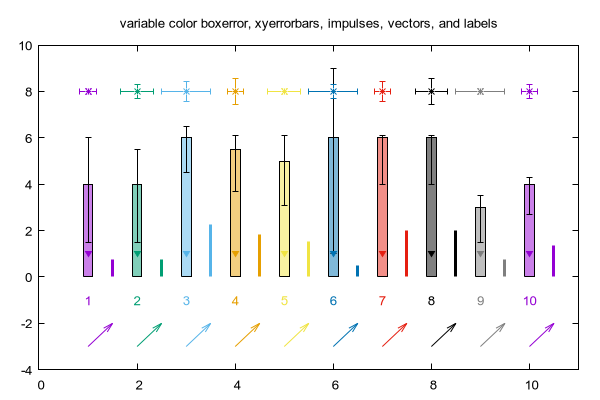


set title "variable color boxerror, xyerrorbars, impulses, vectors, and labels"
unset colorbox
plot 'candlesticks.dat' \
        using 1:5:2:6:(.2):1 with boxerror fc var fs solid 0.5 border -1 , \
     '' using 1:(1):1 with points pt 11 lc variable, \
     '' using 1:(8):(by3($0)):(by4($0)):1 with xyerrorbars lc var, \
     '' using ($1+.5):($2/2):1 with impulses lc var lw 3,\
     '' using 1:(-3):(0.5):(1):1 with vectors lc var,\
     '' using 1:(-1):1:1 with labels tc variable


Click here for minimal script to generate this plot
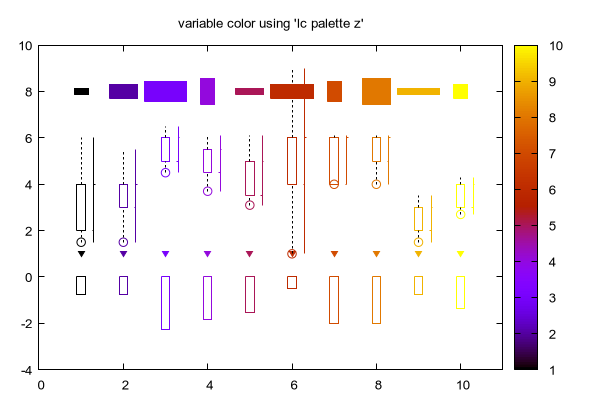


set title "variable color using 'lc palette z'"
set colorbox
set errorbars lw 1.0 lc black dt '-'
plot 'candlesticks.dat' using 1:(1):1 with points pt 11 lc pal z, \
     '' using 1:2:(.1):1 with circles lc pal z, \
     '' using 1:3:2:6:5:1 with candlesticks lc pal z, \
     '' using ($1+.3):3:2:6:5:1 with financebars lc pal z, \
     '' using 1:(8):(by3($0)):(by4($0)):1 with boxxy fc pal z fs solid, \
     '' using 1:(-$2/2):1 with boxes lc pal z


Click here for minimal script to generate this plot


set errorbars
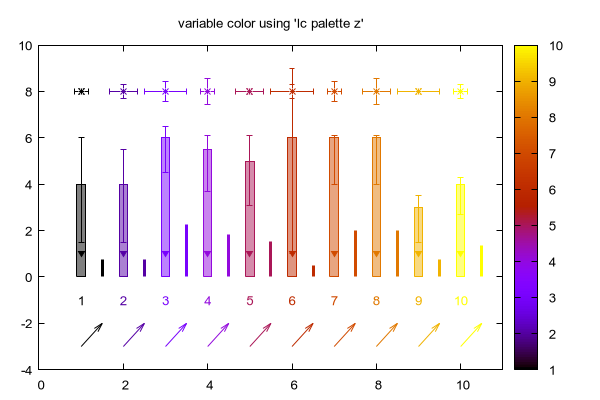
plot 'candlesticks.dat' \
        using 1:5:2:6:(.2):1 with boxerror lc pal z fs solid 0.5, \
     '' using 1:(1):1 with points pt 11 lc pal z, \
     '' using 1:(8):(by3($0)):(by4($0)):1 with xyerrorbars lc pal z, \
     '' using ($1+.5):($2/2):1 with impulses lc pal z lw 3,\
     '' using 1:(-3):(0.5):(1):1 with vectors lc pal z,\
     '' using 1:(-1):1:1 with labels tc pal z


Click here for minimal script to generate this plot
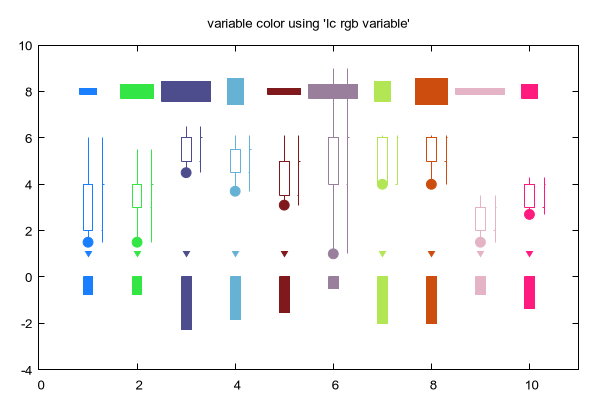


set title "variable color using 'lc rgb variable'"
plot 'candlesticks.dat' using 1:(1):(rgbfudge($1)) with points pt 11 lc rgb var, \
     '' using 1:2:(.1):(rgbfudge($1)) with circles fs solid fc rgb var, \
     '' using 1:3:2:6:5:(rgbfudge($1)) with candlesticks lc rgb var, \
     '' using ($1+.3):3:2:6:5:(rgbfudge($1)) with financebars lc rgb var, \
     '' using 1:(8):(by3($0)):(by4($0)):(rgbfudge($1)) with boxxy fc rgb var fs solid, \
     '' using 1:(-$2/2):(rgbfudge($1)) with boxes fs solid fc rgb var


Click here for minimal script to generate this plot
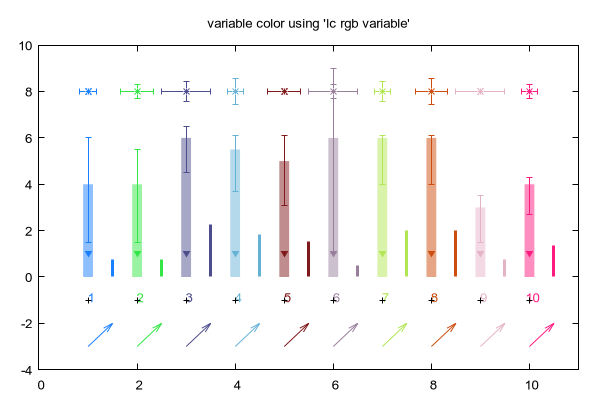


plot 'candlesticks.dat' \
        using 1:5:2:6:(.2):(rgbfudge($1)) with boxerror lc rgb var fs solid 0.5 noborder, \
     '' using 1:(1):(rgbfudge($1)) with points pt 11 lc rgb var, \
     '' using 1:(8):(by3($0)):(by4($0)):(rgbfudge($1)) with xyerrorbars lc rgb var, \
     '' using ($1+.5):($2/2):(rgbfudge($1)) with impulses lc rgb var lw 3,\
     '' using 1:(-3):(0.5):(1):(rgbfudge($1)) with vectors lc rgb var,\
     '' using 1:(-1):1:(rgbfudge($1)) with labels tc rgb var point


Click here for minimal script to generate this plot
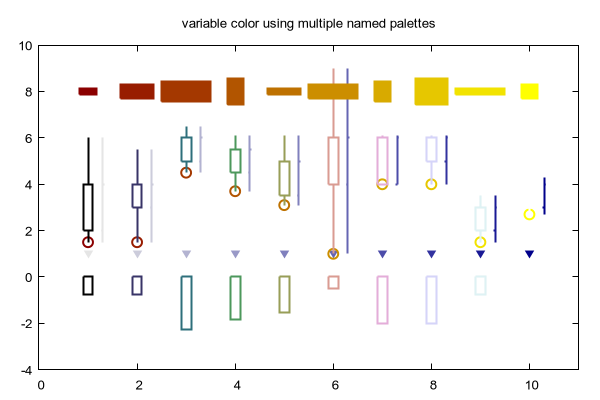


set title "variable color using multiple named palettes"

set palette defined (0 "gray90", 1 "dark-blue")
set colormap new blues
set palette defined (0 "dark-red", 1 "yellow" )
set colormap new flame
set palette cubehelix
set colormap new ch
unset colorbox

set for [i=1:10] linetype i lw 2.0

plot 'candlesticks.dat' using 1:(1):1 with points pt 11 lc pal blues, \
     '' using 1:2:(.1):1 with circles lc pal flame, \
     '' using 1:3:2:6:5:1 with candlesticks lc pal ch, \
     '' using ($1+.3):3:2:6:5:1 with financebars lc pal blues, \
     '' using 1:(8):(by3($0)):(by4($0)):1 with boxxy lc pal flame fs solid, \
     '' using 1:(-$2/2):1 with boxes lc pal ch


Click here for minimal script to generate this plot
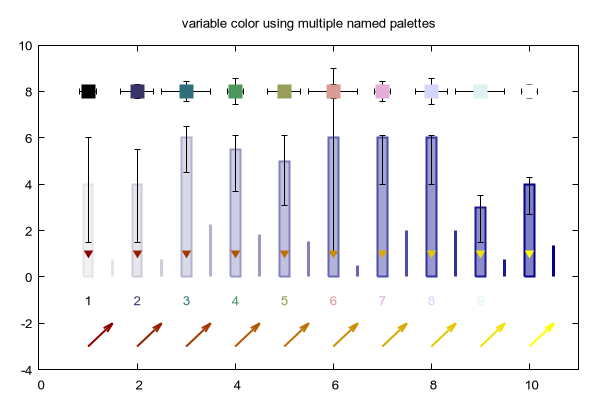


set errorbars lw 1.0 lc black dt solid
plot 'candlesticks.dat' \
        using 1:5:2:6:(.2):1 with boxerror lc pal blues fs solid 0.5, \
     '' using 1:(1):1 with points pt 11 lc pal flame, \
     '' using 1:(8):(by3($0)):(by4($0)):1 with xyerrorbars pt 5 ps 2 lc pal ch, \
     '' using ($1+.5):($2/2):1 with impulses lc pal blues lw 3,\
     '' using 1:(-3):(0.5):(1):1 with vectors lc pal flame,\
     '' using 1:(-1):1:1 with labels tc pal z


Click here for minimal script to generate this plot