#
# Define a set of marks that represent windbarbs in standard format
# Use "plot with marks" to plot a temperature, wind speed and direction
# vs time using appropriate barbs
#
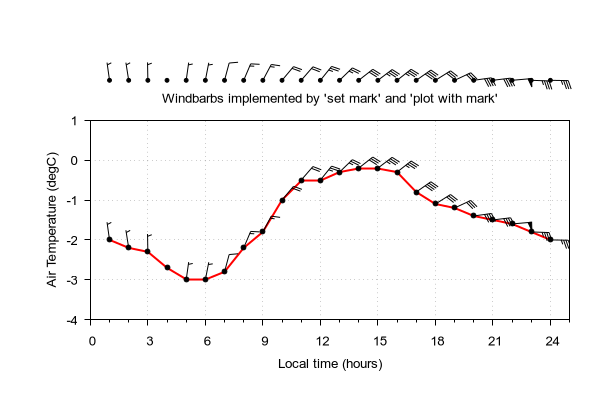
set title "Windbarbs implemented by 'set mark' and 'plot with mark'"

set angle degrees
set theta top cw

do for [i=0:200:5] {
  set mark i "windbarb.dat" index sprintf("%i", i)
}

$data <<EOD
1 -2   352 4
2 -2.2 351 3
3 -2.3 359 3
4 -2.7 0 0
5 -3.0 8 3
6 -3.0 11 7
7 -2.8 15 12
8 -2.2 23 13
9 -1.8 28 15
10 -1.0 40 20
11 -0.5 41 21
12 -0.5 39 23
13 -0.3 46 25
14 -0.2 52 31
15 -0.2 53 33
16 -0.3 52 34
17 -0.8 55 38
18 -1.1 58 32
19 -1.2 65 28
20 -1.4 82 38
21 -1.5 83 40
22 -1.6 85 49
23 -1.8 92 34
24 -2.0 91 33
EOD

set tmargin screen 0.7
set bmargin screen 0.2
set rmargin screen 0.95
set lmargin screen 0.15

set xrange [0:25]
set yrange [-4:1]
set xlabel "Local time (hours)"
set ylabel "Air Temperature (degC)"
set xtics 3 nomirror out
set ytics out nomirror
set mxtics 3
set grid
unset key

round5(x) = round(x/5)*5

do for [k=1:|$data|] {
  v = split($data[k])
  set object mark mt round5(real(v[4])) at v[1],screen 0.8 scale 3 angle v[3] lw 1 fill solid
  set object circle at v[1],screen 0.8 size 0.1 lw 1 fill solid
}

plot $data using 1:2:(0.1) with lines lw 2 lc "red",\
     $data using 1:2 with points pt 7 ps 0.8 lc "black", \
     $data using 1:2:(1):(1):3:(round5($4)) with marks mt variable ps 3 lc "black" lw 1 fill solid ,\


Click here for minimal script to generate this plot
