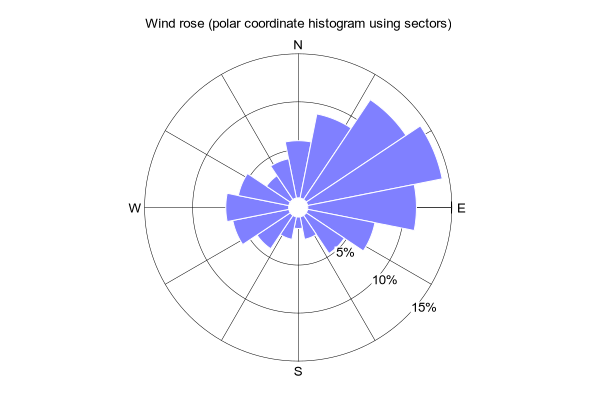
# Wind rose created using plot style "sectors"
#
set title "Wind rose (polar coordinate histogram using sectors)"

$data <<EOD
# DIRECTION INDEX COUNT
N    1  10
NNE  2  15
NE   3  21
ENE  4  24
E    5  19
ESE  6  12
SE   7   8
SSE  8   4
S    9   2
SSW 10   4
SW  11   7
WSW 12  10
W   13  11
WNW 14   9
NW  15   5
NNW 16   7
EOD

unset polar
stats $data using 2:3 nooutput

set polar
set angle degrees
set theta top cw

set xrange [-0.2:0.2]
set yrange [-0.2:0.2]
set size ratio -1
set title offset 0,-2

unset border
unset key
unset raxis
unset tics
set margins -1,-1,0,1

roff = 0.01
set grid polar lt -1 lw .5
set rtics roff, .05, .20 format ""
set style fill solid 0.5 border lc bgnd

set obj 1 circle at polar 0,0 radius roff fs solid fc bgnd
set style textbox opaque noborder margin 0.5, 0.5
set label 1 center at polar   0, .17 "N"
set label 2 center at polar  90, .17 "E"
set label 3 center at polar 180, .17 "S"
set label 4 center at polar 270, .17 "W"

array dummy[1]
plot $data using (22.5*($2-1-0.5)):(roff):(22.5):($3/STATS_sum_y) with sectors fc rgb "blue", \
     for [k=5:15:5] dummy using (125):(roff+k/100.0):(sprintf("%d%%",k)) with labels boxed offset 0,-0.75


Click here for minimal script to generate this plot
