New plot styles
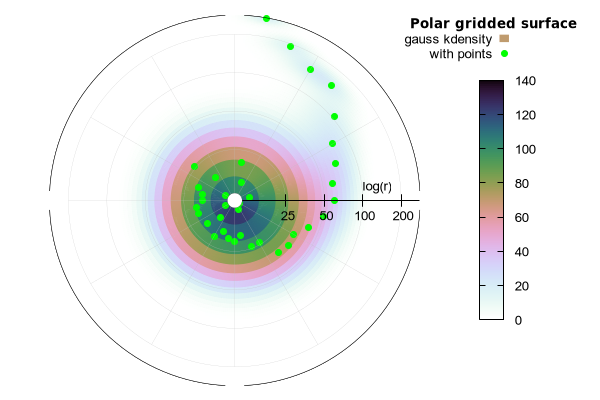
- The plot style with surface works in 2D polar coordinates to produce
a solid-fill gridded representation of the plane, colored by weighted contributions from an arbitrary set of input points. This is analogous to the use of dgrid3d and style with pm3d to produce a 3D gridded surface. See set polar grid and polar heatmap.
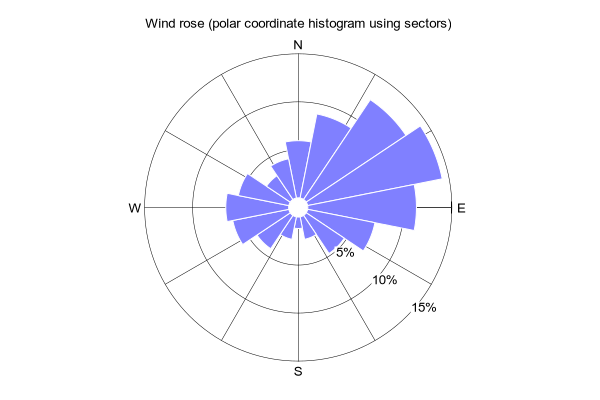
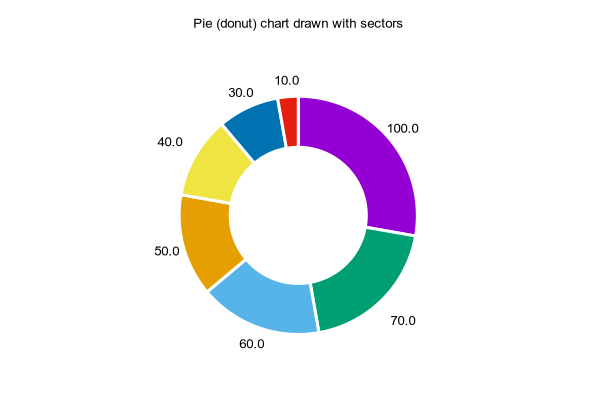
- New 2D plot style with sectors is an alternative to generating a full
polar gridded surface. For each input data point it generates a single annular wedge in a conceptual polar grid. Unlike polar mode with surface it can be used in either a polar or cartesian coordinate graph.
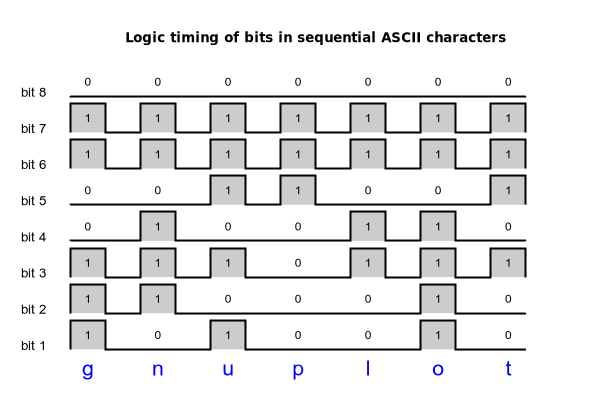
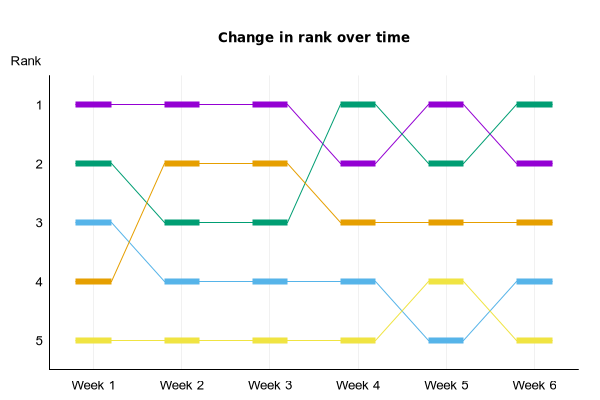
- New 2D plot style with hsteps allows construction of step-like plots with
a variety of representations in addition to those offered by existing styles steps, histeps, fsteps, and fillsteps. See hsteps.
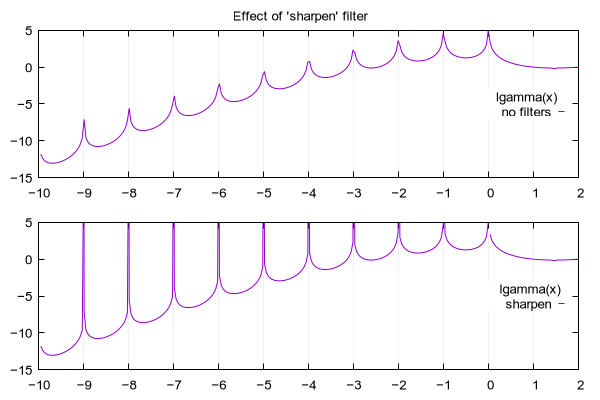
- Plot style with lines now has a filter option sharpen. This filter
detects spikes in a function plot that appear truncated in the output because the peak lies between two x-coordinates at which the function has been sampled. It adds a new sample point at the location of each such peak. See filters.
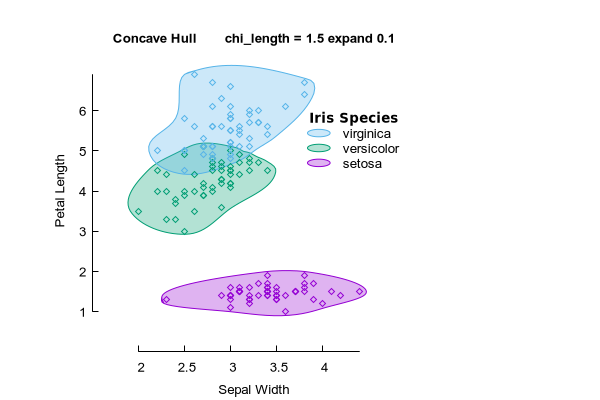
- Although it is not strictly speaking a new plot style, the combination
of the concave hull filter with along-path smoothing of filled areas allows creation of 'blobby region' plots showing, for example, the extents of overlapping data clusters. See concavehull.
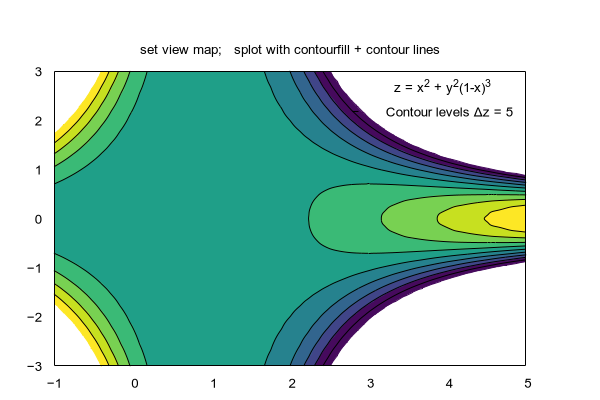
- 3D plot style with pm3d accepts an optional modifier zclip [zmin:zmax]
that selects only a slice of the full surface. Successive plots with incremental changes to the clipping limits can be used to animate a cross-sectional cutaway view in 3D or to create a filled area contour map. This is automated by a new plot style with contourfill that is particularly useful in 2D projection. See contourfill.
