| Credits | Overview | Plotting Styles | Commands | Terminals |
|---|
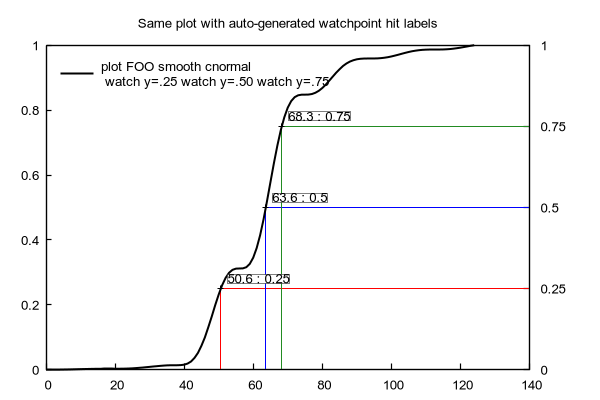
By default, labels are always generated for the target "watch mouse". You can turn labels on for other watch targets using the command set style watchpoint labels or by specifying a label as part of the watchpoint target in a plot command.
The default label text is "x : y", where x and y are the coordinates of the point, formatted using the current settings for the corresponding axes.
Example:
     set y2tics format "%.2f°"
     set style watchpoint labels point pt 6
     plot FOO axes x1y2 watch mouse

You can provide a customized label for each watch target, either as a string constant or via function that returns a string.
Examples:
     set style data lines
     plot FOO watch y=50 label "50" watch y=100 label "100"
     f(x,y) = 2*x - y      # f(x,y) = 0 defines a sloping line
     plot $CONTOURS using 1:2:3 watch f(x,y) = 0 label sprintf("%.2f",z)
Each watchpoint label is placed in a textbox. See set style textbox.