| Credits | Overview | Plotting Styles | Commands | Terminals |
|---|
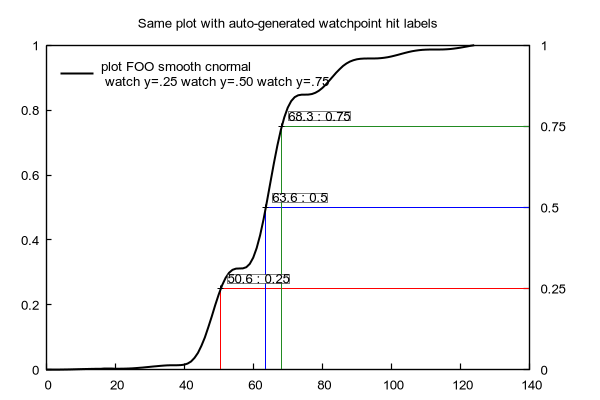
Watchpoints are target values associated with individual plots in a graph. As that plot is drawn, each component line segment is monitored to see if its endpoints bracket the target value of a watchpoint coordinate (x, y, or z) or function f(x,y). If a match is found, the [x,y] coordinates of the match point are saved for later use. See watchpoints. Possible uses include