| Credits | Overview | Plotting Styles | Commands | Terminals |
|---|
     set style fill solid border lc "black"
     splot for [scan=N:1:-1] DATA index scan \
           using x:y:z with filledcurves fc background
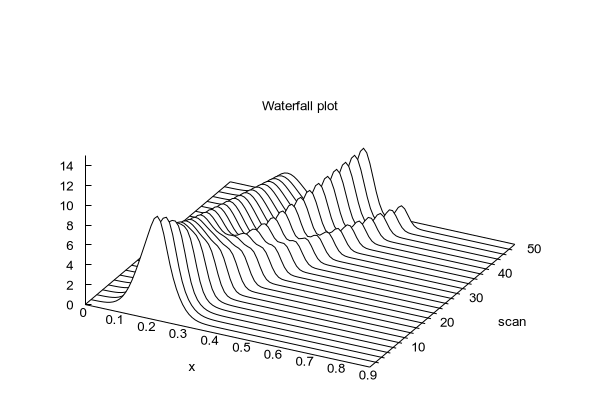
In gnuplot 6.1 the 3D filledcurves plot style is designed to display a set of two-dimensional curves that are incrementally displaced along an orthogonal axis. Normally x or y is a fixed value for each curve so that the lines either represent z=f(x) at sequential y values or z=f(y) at sequential x values. This is convenient for drawing waterfall plots.
In order to ensure that foreground curves occlude more distant ones it is important to order the sequence of curves from back to front.
See also fenceplots.